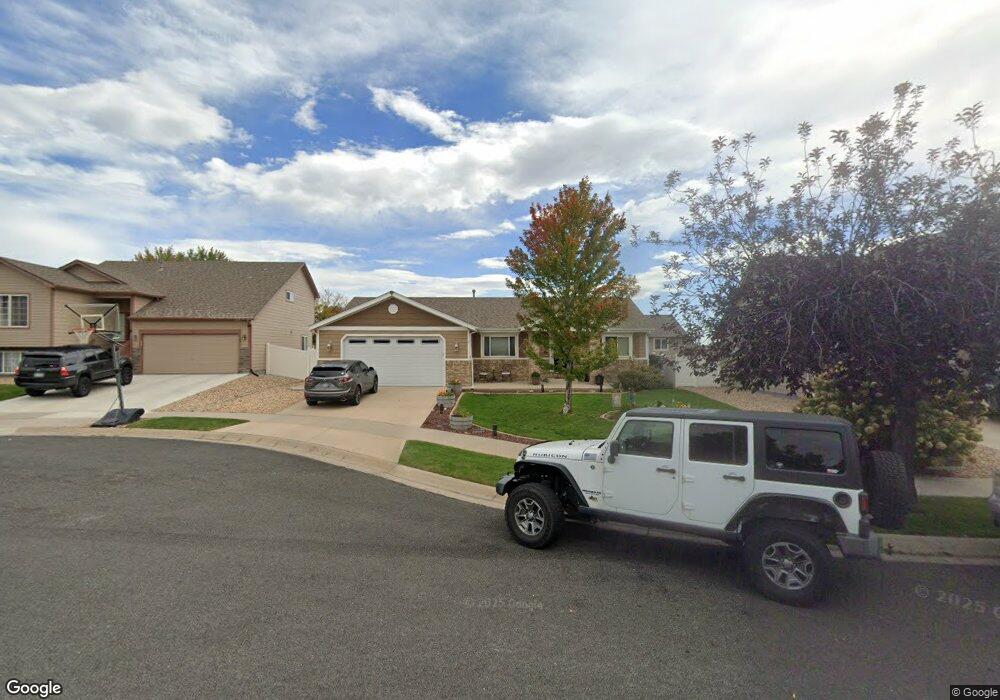
3422 Sauvignon Ct Greeley, CO 80634
Estimated Value: $436,241 - $484,000
4
Beds
3
Baths
1,448
Sq Ft
$317/Sq Ft
Est. Value
About This Home
This home is located at 3422 Sauvignon Ct, Greeley, CO 80634 and is currently estimated at $459,060, approximately $317 per square foot. 3422 Sauvignon Ct is a home located in Weld County with nearby schools including Greeley West High School, Union Colony Preparatory School, and Mountain View Academy.
Ownership History
Date
Name
Owned For
Owner Type
Purchase Details
Closed on
Jun 13, 2025
Sold by
Dean Donna Mae
Bought by
Walter Janine R and Hiatt Ronald Eugene
Current Estimated Value
Purchase Details
Closed on
Nov 2, 2021
Sold by
Hoffman Edward
Bought by
Hoffman Tammy K
Purchase Details
Closed on
Oct 12, 2012
Sold by
Hoffman Tammy
Bought by
Hoffman Tammy K and Hoffman Edward
Purchase Details
Closed on
Sep 18, 2006
Sold by
Streeter Tammy K and Hoffman Tammy K
Bought by
Hoffman Tammy K
Purchase Details
Closed on
Mar 22, 2004
Sold by
Fox Creek Development Llc
Bought by
Streeter Tammy K
Home Financials for this Owner
Home Financials are based on the most recent Mortgage that was taken out on this home.
Original Mortgage
$187,500
Interest Rate
5.59%
Mortgage Type
Construction
Create a Home Valuation Report for This Property
The Home Valuation Report is an in-depth analysis detailing your home's value as well as a comparison with similar homes in the area
Home Values in the Area
Average Home Value in this Area
Purchase History
| Date | Buyer | Sale Price | Title Company |
|---|---|---|---|
| Walter Janine R | -- | None Listed On Document | |
| Hoffman Tammy K | -- | None Available | |
| Hoffman Tammy K | -- | Fidelity National Title Insu | |
| Hoffman Tammy K | -- | None Available | |
| Streeter Tammy K | $51,500 | -- |
Source: Public Records
Mortgage History
| Date | Status | Borrower | Loan Amount |
|---|---|---|---|
| Previous Owner | Streeter Tammy K | $187,500 |
Source: Public Records
Tax History Compared to Growth
Tax History
| Year | Tax Paid | Tax Assessment Tax Assessment Total Assessment is a certain percentage of the fair market value that is determined by local assessors to be the total taxable value of land and additions on the property. | Land | Improvement |
|---|---|---|---|---|
| 2025 | $2,557 | $28,630 | $7,190 | $21,440 |
| 2024 | $2,557 | $28,630 | $7,190 | $21,440 |
| 2023 | $2,449 | $31,490 | $6,770 | $24,720 |
| 2022 | $2,316 | $24,280 | $4,730 | $19,550 |
| 2021 | $2,388 | $24,970 | $4,860 | $20,110 |
| 2020 | $2,273 | $23,840 | $3,580 | $20,260 |
| 2019 | $2,279 | $23,840 | $3,580 | $20,260 |
| 2018 | $1,833 | $20,140 | $3,240 | $16,900 |
| 2017 | $1,842 | $20,140 | $3,240 | $16,900 |
| 2016 | $1,441 | $17,540 | $2,310 | $15,230 |
| 2015 | $1,437 | $17,540 | $2,310 | $15,230 |
| 2014 | $1,137 | $13,580 | $1,030 | $12,550 |
Source: Public Records
Map
Nearby Homes
- 3315 Sapphire Ct
- 3311 Sapphire Ct
- 3308 Sapphire Ct
- 3307 Sapphire Ct
- 3304 Sapphire Ct
- 3303 Sapphire Ct
- 3300 Sapphire Ct
- 3218 Grenache St
- 3316 Barbera St
- 6340 Orchard Park Dr Unit 2
- 3127 58th Ave
- 3217 Barbera St
- 6460 Orchard Park Dr Unit 4
- 3696 65th Ave
- 5803 W 31st St
- 3115 Barbera St
- 5532 Pawnee Ln
- 6612 34th St
- 3220 66th Avenue Ct
- 3216 66th Avenue Ct
- 3426 Sauvignon Ct
- 3418 Sauvignon Ct
- 3419 Syrah St
- 3423 Syrah St
- 3430 Sauvignon Ct
- 3415 Syrah St
- 3414 Sauvignon Ct
- 3427 Syrah St
- 3421 Sauvignon Ct
- 3409 Sauvignon Ct
- 3425 Sauvignon Ct
- 3411 Syrah St
- 3417 Sauvignon Ct
- 3429 Sauvignon Ct
- 3413 Sauvignon Ct
- 5708 Pinot St
- 5704 Pinot St
- 5712 Pinot St
- 5706 Sauvignon St
- 5710 Sauvignon St