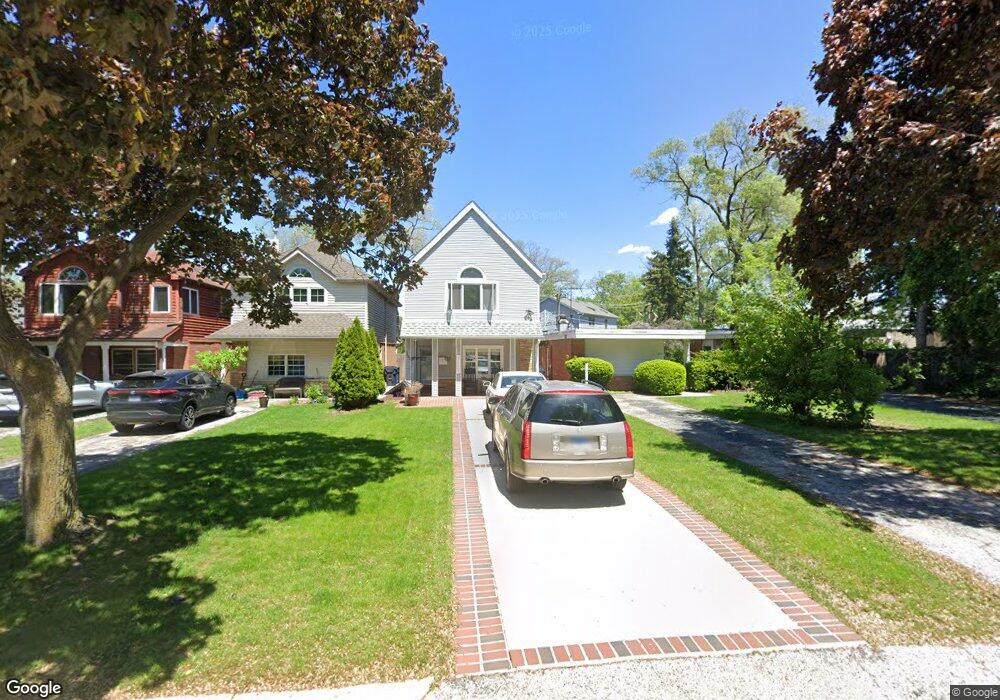
3423 Central St Evanston, IL 60201
Central Street NeighborhoodEstimated Value: $477,597 - $570,000
3
Beds
2
Baths
1,440
Sq Ft
$355/Sq Ft
Est. Value
About This Home
This home is located at 3423 Central St, Evanston, IL 60201 and is currently estimated at $510,649, approximately $354 per square foot. 3423 Central St is a home located in Cook County with nearby schools including Willard Elementary School, Haven Middle School, and Evanston Township High School.
Ownership History
Date
Name
Owned For
Owner Type
Purchase Details
Closed on
Nov 15, 2001
Sold by
Khandros Irina
Bought by
Raphael Donald J
Current Estimated Value
Home Financials for this Owner
Home Financials are based on the most recent Mortgage that was taken out on this home.
Original Mortgage
$203,000
Outstanding Balance
$79,108
Interest Rate
6.68%
Mortgage Type
VA
Estimated Equity
$431,541
Purchase Details
Closed on
Jun 10, 1999
Sold by
Khandros Yury
Bought by
Khandros Irina
Purchase Details
Closed on
Apr 27, 1995
Sold by
Quinn Michael K
Bought by
Khandros Yury and Khandros Irina
Home Financials for this Owner
Home Financials are based on the most recent Mortgage that was taken out on this home.
Original Mortgage
$72,100
Interest Rate
11.75%
Create a Home Valuation Report for This Property
The Home Valuation Report is an in-depth analysis detailing your home's value as well as a comparison with similar homes in the area
Home Values in the Area
Average Home Value in this Area
Purchase History
| Date | Buyer | Sale Price | Title Company |
|---|---|---|---|
| Raphael Donald J | $247,000 | Chicago Title Insurance Co | |
| Khandros Irina | -- | Chicago Title Insurance Co | |
| Khandros Yury | $103,000 | -- |
Source: Public Records
Mortgage History
| Date | Status | Borrower | Loan Amount |
|---|---|---|---|
| Open | Raphael Donald J | $203,000 | |
| Previous Owner | Khandros Yury | $72,100 |
Source: Public Records
Tax History Compared to Growth
Tax History
| Year | Tax Paid | Tax Assessment Tax Assessment Total Assessment is a certain percentage of the fair market value that is determined by local assessors to be the total taxable value of land and additions on the property. | Land | Improvement |
|---|---|---|---|---|
| 2024 | $6,944 | $32,001 | $4,868 | $27,133 |
| 2023 | $6,638 | $32,001 | $4,868 | $27,133 |
| 2022 | $6,638 | $32,001 | $4,868 | $27,133 |
| 2021 | $6,644 | $28,365 | $3,245 | $25,120 |
| 2020 | $6,615 | $28,365 | $3,245 | $25,120 |
| 2019 | $6,484 | $31,102 | $3,245 | $27,857 |
| 2018 | $9,654 | $38,672 | $2,655 | $36,017 |
| 2017 | $10,203 | $41,614 | $2,655 | $38,959 |
| 2016 | $9,899 | $41,614 | $2,655 | $38,959 |
| 2015 | $9,349 | $37,492 | $2,212 | $35,280 |
| 2014 | $9,275 | $37,492 | $2,212 | $35,280 |
| 2013 | $9,046 | $37,492 | $2,212 | $35,280 |
Source: Public Records
Map
Nearby Homes
- 3451 Harrison St
- 2501 Crawford Ave
- 3233 Central St
- 2424 Cowper Ave
- 2663 Lawndale Ave
- 2047 Wilmette Ave
- 1918 Wilmette Ave Unit B
- 9628 Keystone Ave
- 2951 Colfax St
- 2536 Old Glenview Rd
- 115 16th St
- 1517 Gregory Ave
- 2239 Washington Ave
- 2716 Ewing Ave
- 2221 Lincolnwood Dr
- 1531 Wilmette Ave
- 10015 Beverly Dr Unit 105
- 2726 Central St Unit 3D
- 2720 Central St Unit 4C
- 1936 Birchwood Ave
- 3421 Central St
- 3425 Central St
- 3427 Central St
- 3419 Central St
- 3429 Central St
- 3501 Central St
- 2630 Crawford Ave
- 3503 Central St
- 3510 Hillside Rd
- 2636 Crawford Ave
- 3507 Central St
- 3512 Hillside Rd
- 3504 Hillside Rd
- 3516 Hillside Rd
- 3509 Central St
- 2600 Crawford Ave
- 3513 Central St
- 3520 Hillside Rd
- 3522 Hillside Rd
- 3517 Central St