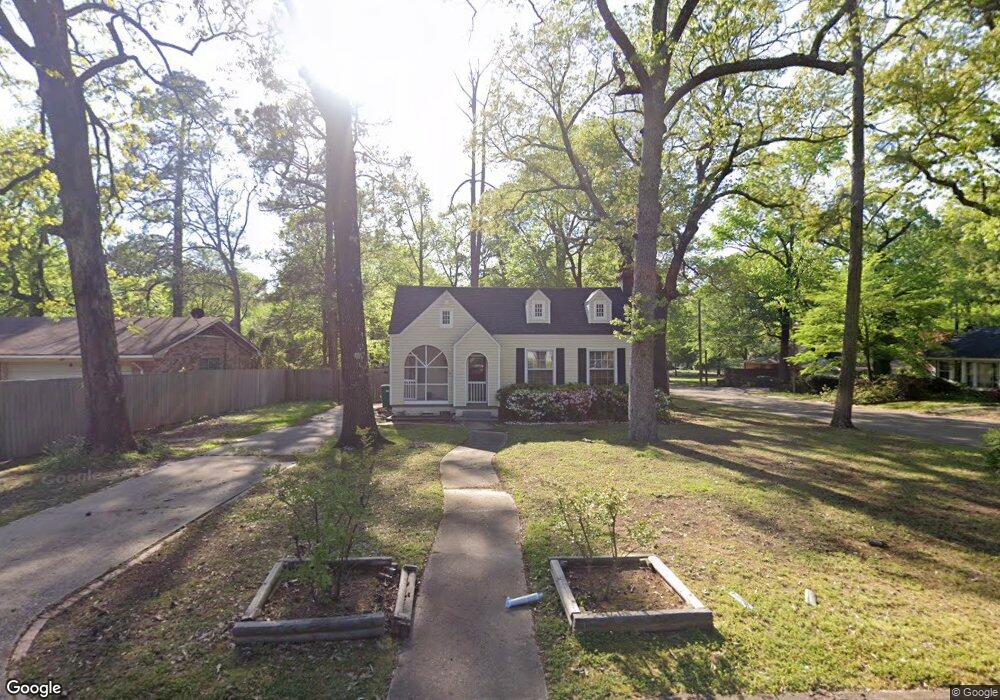
3423 Hazel St Texarkana, TX 75503
Estimated Value: $144,000 - $177,000
3
Beds
2
Baths
1,509
Sq Ft
$108/Sq Ft
Est. Value
About This Home
This home is located at 3423 Hazel St, Texarkana, TX 75503 and is currently estimated at $163,052, approximately $108 per square foot. 3423 Hazel St is a home located in Bowie County with nearby schools including Highland Park Elementary School, Texas Middle School, and Texas High School.
Ownership History
Date
Name
Owned For
Owner Type
Purchase Details
Closed on
Apr 21, 2021
Sold by
Woodruff Investments Llc
Bought by
Thompson Mary Rebecca
Current Estimated Value
Purchase Details
Closed on
Apr 12, 2005
Sold by
Cornett Michael A
Bought by
Williams Karen
Home Financials for this Owner
Home Financials are based on the most recent Mortgage that was taken out on this home.
Original Mortgage
$56,000
Interest Rate
7.97%
Mortgage Type
Adjustable Rate Mortgage/ARM
Create a Home Valuation Report for This Property
The Home Valuation Report is an in-depth analysis detailing your home's value as well as a comparison with similar homes in the area
Home Values in the Area
Average Home Value in this Area
Purchase History
| Date | Buyer | Sale Price | Title Company |
|---|---|---|---|
| Thompson Mary Rebecca | -- | None Available | |
| Williams Karen | -- | None Available |
Source: Public Records
Mortgage History
| Date | Status | Borrower | Loan Amount |
|---|---|---|---|
| Previous Owner | Williams Karen | $56,000 |
Source: Public Records
Tax History Compared to Growth
Tax History
| Year | Tax Paid | Tax Assessment Tax Assessment Total Assessment is a certain percentage of the fair market value that is determined by local assessors to be the total taxable value of land and additions on the property. | Land | Improvement |
|---|---|---|---|---|
| 2025 | $3,053 | $138,966 | $10,000 | $128,966 |
| 2024 | $3,053 | $128,973 | $10,000 | $118,973 |
| 2023 | $2,859 | $120,738 | $10,000 | $110,738 |
| 2022 | $2,619 | $109,709 | $10,000 | $99,709 |
| 2021 | $2,301 | $89,977 | $10,000 | $79,977 |
| 2020 | $2,221 | $86,401 | $10,000 | $76,401 |
| 2019 | $2,083 | $78,084 | $10,000 | $68,084 |
| 2018 | $2,043 | $76,585 | $10,000 | $66,585 |
| 2017 | $1,958 | $73,622 | $10,000 | $63,622 |
| 2016 | $1,940 | $72,939 | $10,000 | $62,939 |
| 2015 | $1,289 | $72,339 | $10,000 | $62,339 |
| 2014 | $1,289 | $70,091 | $10,000 | $60,091 |
Source: Public Records
Map
Nearby Homes