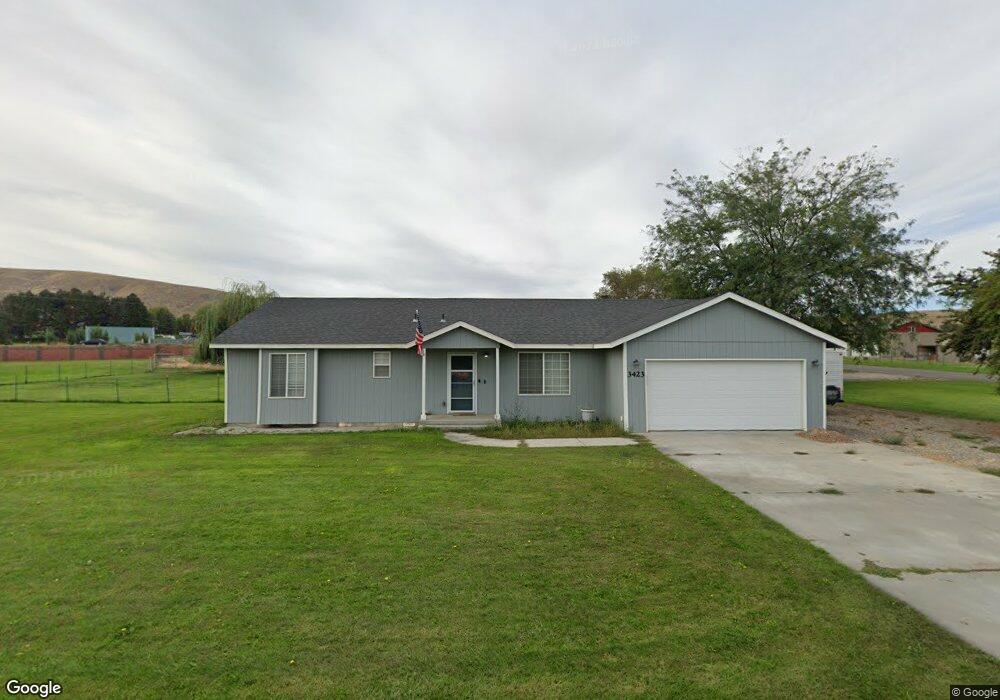
3423 Rocky Mountain Rd Unit West Richland Home w West Richland, WA 99353
Estimated Value: $458,273 - $586,000
3
Beds
2
Baths
1,278
Sq Ft
$426/Sq Ft
Est. Value
About This Home
This home is located at 3423 Rocky Mountain Rd Unit West Richland Home w, West Richland, WA 99353 and is currently estimated at $543,818, approximately $425 per square foot. 3423 Rocky Mountain Rd Unit West Richland Home w is a home located in Benton County with nearby schools including White Bluffs Elementary School, Enterprise Middle School, and Richland High School.
Ownership History
Date
Name
Owned For
Owner Type
Purchase Details
Closed on
Dec 2, 2020
Sold by
Larson Joshua and Karabalch Nikki
Bought by
Bach David E
Current Estimated Value
Home Financials for this Owner
Home Financials are based on the most recent Mortgage that was taken out on this home.
Original Mortgage
$400,932
Outstanding Balance
$357,586
Interest Rate
2.8%
Mortgage Type
VA
Estimated Equity
$186,232
Purchase Details
Closed on
Feb 9, 2017
Sold by
Larson Joshua Charles
Bought by
Larson Joshua Charles and Karabaich Nikki Anna
Purchase Details
Closed on
Nov 28, 2016
Sold by
Aarde William Richard and Aarde Rebekah K
Bought by
Larson Joshua C
Home Financials for this Owner
Home Financials are based on the most recent Mortgage that was taken out on this home.
Original Mortgage
$280,912
Interest Rate
3.52%
Mortgage Type
VA
Create a Home Valuation Report for This Property
The Home Valuation Report is an in-depth analysis detailing your home's value as well as a comparison with similar homes in the area
Home Values in the Area
Average Home Value in this Area
Purchase History
| Date | Buyer | Sale Price | Title Company |
|---|---|---|---|
| Bach David E | $387,000 | Ticor Title Company | |
| Larson Joshua Charles | -- | None Available | |
| Larson Joshua C | $275,000 | Cascade Title Company |
Source: Public Records
Mortgage History
| Date | Status | Borrower | Loan Amount |
|---|---|---|---|
| Open | Bach David E | $400,932 | |
| Previous Owner | Larson Joshua C | $280,912 |
Source: Public Records
Tax History Compared to Growth
Tax History
| Year | Tax Paid | Tax Assessment Tax Assessment Total Assessment is a certain percentage of the fair market value that is determined by local assessors to be the total taxable value of land and additions on the property. | Land | Improvement |
|---|---|---|---|---|
| 2024 | $3,291 | $346,620 | $95,200 | $251,420 |
| 2023 | $3,291 | $307,940 | $95,200 | $212,740 |
| 2022 | $4,045 | $319,540 | $95,200 | $224,340 |
| 2021 | $3,842 | $327,280 | $95,200 | $232,080 |
| 2020 | $3,892 | $297,590 | $95,200 | $202,390 |
| 2019 | $2,372 | $289,490 | $95,200 | $194,290 |
| 2018 | $2,354 | $188,400 | $41,700 | $146,700 |
| 2017 | $2,083 | $161,760 | $41,700 | $120,060 |
| 2016 | $2,535 | $161,760 | $41,700 | $120,060 |
| 2015 | $2,557 | $161,760 | $41,700 | $120,060 |
| 2014 | -- | $161,760 | $41,700 | $120,060 |
| 2013 | -- | $161,760 | $41,700 | $120,060 |
Source: Public Records
Map
Nearby Homes
- 20906 Bretz Prairie NE
- 3700 Arena Rd
- 1004 Sirron Ave
- 3807 E Lattin Rd
- 28509 Dallas Rd
- 900 Cayuse Dr
- 4005 Cascade Dr
- 28605 Dallas Rd
- 4949 Rau Ln
- 4360 Limestone Ct
- 4529 Grove Ct
- 4545 Grove Ct
- 4537 Grove Ct
- 1007 Makah Ct Unit Lot 1
- 1023 Makah Ct Unit Lot 2
- 3529 Hanstead St
- 1055 Makah Ct Unit Lot 4
- 1063 Klamath Ct
- 1058 Klikitat St
- 1056 Makah Ct
- 3423 Rocky Mountain Rd Unit Acreage in West Rich
- 3423 Rocky Mountain Rd
- 3424 Rocky Mountain Rd
- 3426 Rocky Mountain Rd
- 4621 E Mountain Rd
- 3422 Rocky Mountain Rd
- 3421 Rocky Mountain Rd
- 3524 Rocky Mountain Rd
- 3623 Rocky Mountain Rd
- 3526 Rocky Mountain Rd
- 3420 Rocky Mountain Rd
- 3625 Rocky Mountain Rd
- 4503 Mount Daniel Ct
- 3626 Rocky Mountain Rd
- 900 Harvest Lane Prairie NE
- 4502 Mount Daniel Ct Unit 32x56 shop
- 4502 Mount Daniel Ct
- 4501 Mount Daniel Ct
- 3628 Rocky Mountain Rd
- 4620 Mountain Meadows Rd