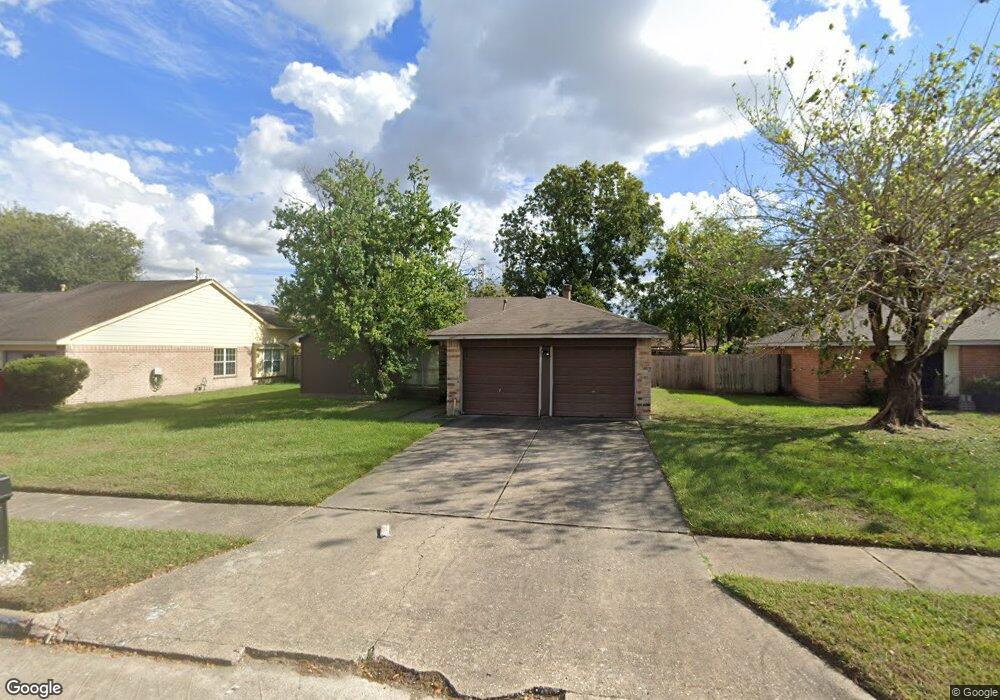
3423 Willow Tree Dr Houston, TX 77066
Champions NeighborhoodEstimated Value: $186,000 - $202,000
3
Beds
2
Baths
1,248
Sq Ft
$154/Sq Ft
Est. Value
About This Home
This home is located at 3423 Willow Tree Dr, Houston, TX 77066 and is currently estimated at $192,281, approximately $154 per square foot. 3423 Willow Tree Dr is a home located in Harris County with nearby schools including Griggs EC/PK/K, Conley Elementary School, and Plummer Middle School.
Ownership History
Date
Name
Owned For
Owner Type
Purchase Details
Closed on
Nov 3, 2000
Sold by
New Era Enterprises Inc
Bought by
Jackson Tammy
Current Estimated Value
Home Financials for this Owner
Home Financials are based on the most recent Mortgage that was taken out on this home.
Original Mortgage
$78,400
Outstanding Balance
$28,930
Interest Rate
7.9%
Mortgage Type
FHA
Estimated Equity
$163,351
Purchase Details
Closed on
Apr 4, 2000
Sold by
Ramirez Brenda and Ramirez Juan Ramon
Bought by
Bank Of America Fsb
Purchase Details
Closed on
Apr 14, 1999
Sold by
Hud
Bought by
Ramirez Juan Ramon and Ramirez Brenda
Home Financials for this Owner
Home Financials are based on the most recent Mortgage that was taken out on this home.
Original Mortgage
$51,100
Interest Rate
7.06%
Purchase Details
Closed on
Oct 28, 1998
Sold by
Norwest Mtg Inc
Bought by
Hud
Purchase Details
Closed on
Aug 4, 1998
Sold by
Montez Gilbert and Montez Ninfa E
Bought by
Norwest Mtg Inc
Create a Home Valuation Report for This Property
The Home Valuation Report is an in-depth analysis detailing your home's value as well as a comparison with similar homes in the area
Home Values in the Area
Average Home Value in this Area
Purchase History
| Date | Buyer | Sale Price | Title Company |
|---|---|---|---|
| Jackson Tammy | -- | Startex Title Company | |
| Bank Of America Fsb | $55,898 | -- | |
| Ramirez Juan Ramon | $52,750 | American Title Co | |
| Hud | -- | -- | |
| Norwest Mtg Inc | $44,226 | -- |
Source: Public Records
Mortgage History
| Date | Status | Borrower | Loan Amount |
|---|---|---|---|
| Open | Jackson Tammy | $78,400 | |
| Previous Owner | Ramirez Juan Ramon | $51,100 |
Source: Public Records
Tax History Compared to Growth
Tax History
| Year | Tax Paid | Tax Assessment Tax Assessment Total Assessment is a certain percentage of the fair market value that is determined by local assessors to be the total taxable value of land and additions on the property. | Land | Improvement |
|---|---|---|---|---|
| 2025 | $2,039 | $173,476 | $38,656 | $134,820 |
| 2024 | $2,039 | $178,424 | $38,656 | $139,768 |
| 2023 | $2,039 | $198,392 | $38,656 | $159,736 |
| 2022 | $2,995 | $168,584 | $25,432 | $143,152 |
| 2021 | $2,886 | $138,745 | $25,432 | $113,313 |
| 2020 | $2,853 | $130,550 | $25,432 | $105,118 |
| 2019 | $2,702 | $110,068 | $13,564 | $96,504 |
| 2018 | $747 | $98,734 | $13,564 | $85,170 |
| 2017 | $2,168 | $98,734 | $13,564 | $85,170 |
| 2016 | $1,971 | $98,734 | $13,564 | $85,170 |
| 2015 | $1,295 | $87,119 | $13,564 | $73,555 |
| 2014 | $1,295 | $61,163 | $13,564 | $47,599 |
Source: Public Records
Map
Nearby Homes
- 14207 Timberhaven Dr
- 14118 Magnolia Springs Dr
- 14003 Valley Grove Dr
- 3407 Sandbrook Dr
- 3240 Brownie Campbell Rd
- 13610 Kaltenbrun Rd
- 13803 Bearwood Rd
- 3519 Hombly Rd
- 11322 Yorklyn Dr
- 2919 Sunwood Dr
- 3230 Hombly Rd
- 13518 Kaltenbrun Rd
- 11335 Chelsea Walk Dr
- 11427 Valarno Dr
- 2606 Owens Cross Dr
- 6610 Northleaf Dr
- 10915 Meadow Walk Ln
- 11009 Panicum Ct
- 3446 Cheaney Dr
- 2410 Irish Spring Dr
- 3427 Willow Tree Dr
- 3419 Willow Tree Dr
- 3414 Creek Grove Dr
- 3410 Creek Grove Dr
- 3431 Willow Tree Dr
- 3415 Willow Tree Dr
- 3418 Creek Grove Dr
- 3406 Creek Grove Dr
- 3422 Willow Tree Dr
- 3426 Willow Tree Dr
- 3418 Willow Tree Dr
- 3422 Creek Grove Dr
- 3402 Creek Grove Dr
- 3411 Willow Tree Dr
- 3435 Willow Tree Dr
- 3430 Willow Tree Dr
- 3414 Willow Tree Dr
- 3426 Creek Grove Dr
- 3362 Creek Grove Dr
- 3434 Willow Tree Dr