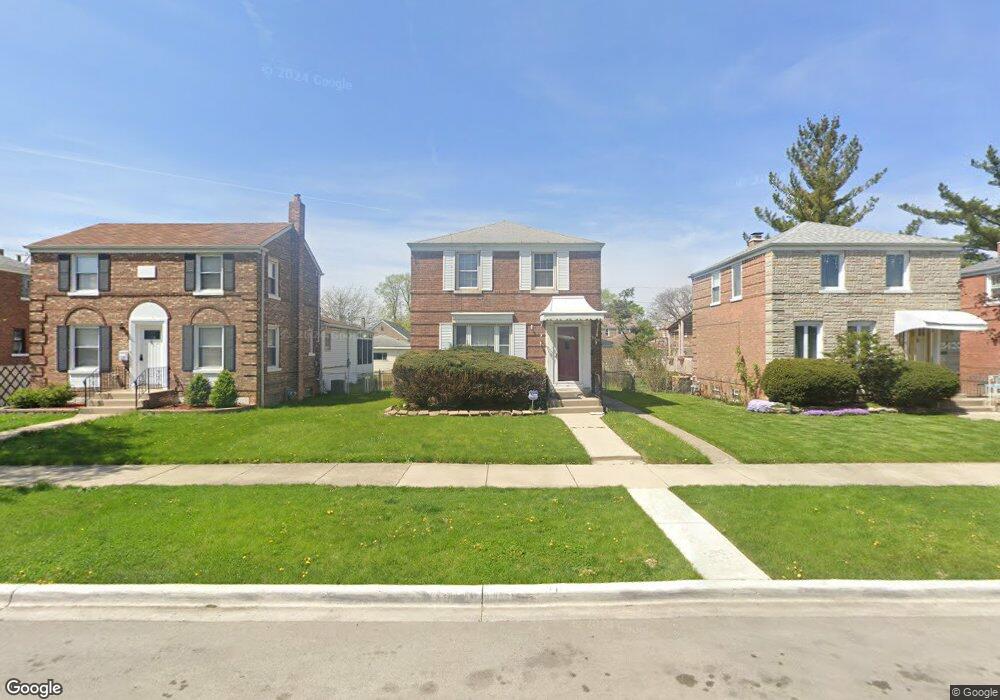
3424 S 56th Ct Cicero, IL 60804
Estimated Value: $151,000 - $277,389
2
Beds
2
Baths
958
Sq Ft
$239/Sq Ft
Est. Value
About This Home
This home is located at 3424 S 56th Ct, Cicero, IL 60804 and is currently estimated at $229,097, approximately $239 per square foot. 3424 S 56th Ct is a home located in Cook County with nearby schools including Abraham Lincoln Elementary School, Unity Jr High School, and J Sterling Morton Freshman Center.
Ownership History
Date
Name
Owned For
Owner Type
Purchase Details
Closed on
Sep 27, 2016
Sold by
Federal Home Loan Mortgage Copr
Bought by
Duque Aracelia
Current Estimated Value
Home Financials for this Owner
Home Financials are based on the most recent Mortgage that was taken out on this home.
Original Mortgage
$98,188
Outstanding Balance
$78,816
Interest Rate
3.5%
Mortgage Type
FHA
Estimated Equity
$150,281
Purchase Details
Closed on
Dec 21, 2015
Sold by
Garcia Miguel and Garcia Lupe
Bought by
Federal Home Loan Mortgage Corporation
Purchase Details
Closed on
Sep 2, 2010
Sold by
Garcia Miguel and Garcia Lupe
Bought by
Garcia Lupe
Purchase Details
Closed on
Jul 19, 1994
Sold by
Ledvina Edward G and Ledvina Terri P
Bought by
Garcia Miguel and Garcia Lupe
Home Financials for this Owner
Home Financials are based on the most recent Mortgage that was taken out on this home.
Original Mortgage
$87,900
Interest Rate
8.38%
Mortgage Type
FHA
Create a Home Valuation Report for This Property
The Home Valuation Report is an in-depth analysis detailing your home's value as well as a comparison with similar homes in the area
Home Values in the Area
Average Home Value in this Area
Purchase History
| Date | Buyer | Sale Price | Title Company |
|---|---|---|---|
| Duque Aracelia | $100,000 | Attorney | |
| Federal Home Loan Mortgage Corporation | -- | Attorney | |
| Garcia Lupe | -- | None Available | |
| Garcia Miguel | $88,300 | -- |
Source: Public Records
Mortgage History
| Date | Status | Borrower | Loan Amount |
|---|---|---|---|
| Open | Duque Aracelia | $98,188 | |
| Previous Owner | Garcia Miguel | $87,900 |
Source: Public Records
Tax History Compared to Growth
Tax History
| Year | Tax Paid | Tax Assessment Tax Assessment Total Assessment is a certain percentage of the fair market value that is determined by local assessors to be the total taxable value of land and additions on the property. | Land | Improvement |
|---|---|---|---|---|
| 2024 | $4,968 | $18,000 | $5,418 | $12,582 |
| 2023 | $5,224 | $18,000 | $5,418 | $12,582 |
| 2022 | $5,224 | $15,382 | $4,662 | $10,720 |
| 2021 | $5,663 | $16,449 | $4,662 | $11,787 |
| 2020 | $5,601 | $16,449 | $4,662 | $11,787 |
| 2019 | $4,343 | $12,331 | $4,284 | $8,047 |
| 2018 | $4,229 | $12,331 | $4,284 | $8,047 |
| 2017 | $5,643 | $12,331 | $4,284 | $8,047 |
| 2016 | $3,924 | $10,674 | $3,528 | $7,146 |
| 2015 | $3,818 | $10,674 | $3,528 | $7,146 |
| 2014 | $3,704 | $10,674 | $3,528 | $7,146 |
| 2013 | $3,908 | $12,087 | $3,528 | $8,559 |
Source: Public Records
Map
Nearby Homes
- 3413 S 56th Ct
- 3524 S Central Ave
- 3307 S 58th Ave
- 3539 S 57th Ct
- 3314 S 58th Ave
- 3633 S 57th Ct
- 3517 S 59th Ave
- 3628 54th Ct
- 3631 S 55th Ct
- 3319 S 59th Ct
- 3529 S 54th Ave
- 3215 S 54th Ct
- 3703 S 58th Ct
- 3615 S 59th Ct
- 3116 S 55th Ave
- 3733 S 57th Ave
- 3141 S 54th Ct
- 5919 W Ogden Ave
- 3606 S 53rd Ct
- 3631 S 54th Ave
- 3420 S 56th Ct
- 3428 S 56th Ct
- 3416 S 56th Ct
- 3432 S 56th Ct
- 3414 S 56th Ct
- 3423 S 57th Ave
- 3423 S 57th Ave
- 3425 S 57th Ave
- 3419 S 57th Ave
- 3427 S 57th Ave
- 3410 S 56th Ct
- 3431 S 57th Ave
- 3417 S 57th Ave
- 3435 S 57th Ave
- 3425 S 56th Ct
- 3423 S 56th Ct
- 3429 S 56th Ct
- 3413 S 57th Ave
- 3408 S 56th Ct
- 3419 S 56th Ct