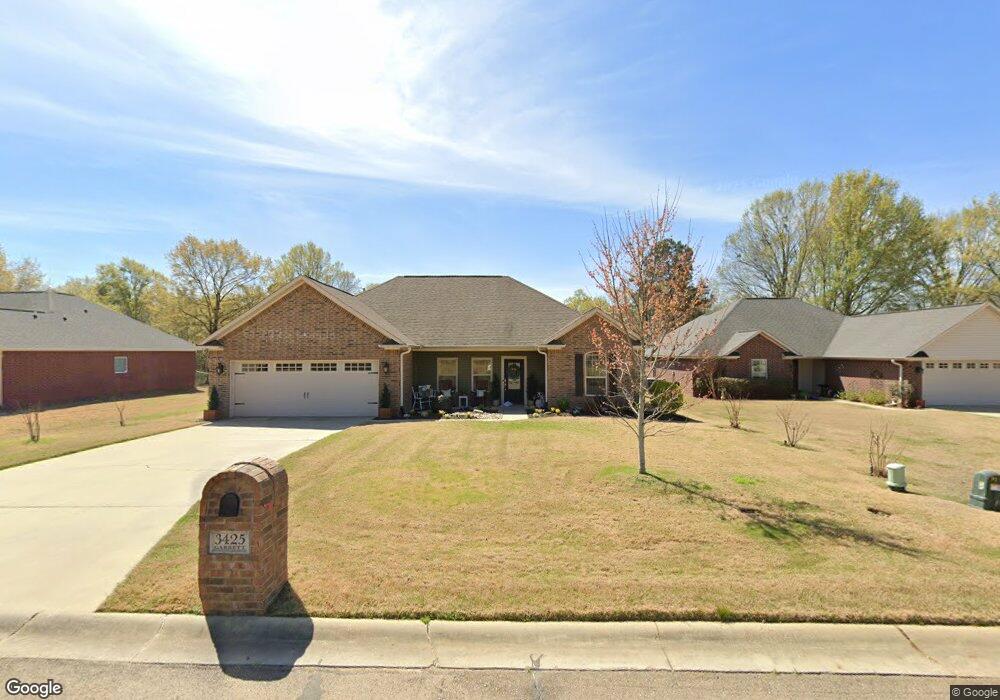
3425 Garrett Ln Texarkana, TX 75503
Estimated Value: $263,000 - $314,000
3
Beds
2
Baths
1,563
Sq Ft
$186/Sq Ft
Est. Value
About This Home
This home is located at 3425 Garrett Ln, Texarkana, TX 75503 and is currently estimated at $291,453, approximately $186 per square foot. 3425 Garrett Ln is a home located in Bowie County with nearby schools including Margaret Fischer Davis Elementary School, Pleasant Grove Intermediate School, and Pleasant Grove Middle School.
Ownership History
Date
Name
Owned For
Owner Type
Purchase Details
Closed on
Jul 23, 2019
Sold by
Hibbs Shannon Nicholas
Bought by
Johnson Eric and Johnson Melissa Dawn
Current Estimated Value
Home Financials for this Owner
Home Financials are based on the most recent Mortgage that was taken out on this home.
Original Mortgage
$166,500
Outstanding Balance
$145,869
Interest Rate
3.82%
Mortgage Type
New Conventional
Estimated Equity
$145,584
Purchase Details
Closed on
Oct 20, 2015
Sold by
Sparks Beverly
Bought by
Hibbs Shannon Nicholas
Purchase Details
Closed on
Oct 19, 2012
Sold by
Txk Lone Star Developments Llc
Bought by
Sparks Gerald H
Home Financials for this Owner
Home Financials are based on the most recent Mortgage that was taken out on this home.
Original Mortgage
$161,000
Interest Rate
3.55%
Mortgage Type
VA
Create a Home Valuation Report for This Property
The Home Valuation Report is an in-depth analysis detailing your home's value as well as a comparison with similar homes in the area
Home Values in the Area
Average Home Value in this Area
Purchase History
| Date | Buyer | Sale Price | Title Company |
|---|---|---|---|
| Johnson Eric | -- | Twin City Title | |
| Hibbs Shannon Nicholas | -- | Twin City Title Company | |
| Sparks Gerald H | -- | Twin City Title Company |
Source: Public Records
Mortgage History
| Date | Status | Borrower | Loan Amount |
|---|---|---|---|
| Open | Johnson Eric | $166,500 | |
| Previous Owner | Sparks Gerald H | $161,000 |
Source: Public Records
Tax History Compared to Growth
Tax History
| Year | Tax Paid | Tax Assessment Tax Assessment Total Assessment is a certain percentage of the fair market value that is determined by local assessors to be the total taxable value of land and additions on the property. | Land | Improvement |
|---|---|---|---|---|
| 2025 | $2,889 | $267,556 | $25,000 | $242,556 |
| 2024 | $2,889 | $255,906 | $25,000 | $235,732 |
| 2023 | $3,873 | $232,642 | $0 | $0 |
| 2022 | $3,965 | $224,767 | $25,000 | $199,767 |
| 2021 | $3,832 | $192,266 | $25,000 | $167,266 |
| 2020 | $3,703 | $184,489 | $25,000 | $159,489 |
| 2019 | $3,870 | $186,418 | $25,000 | $161,418 |
| 2018 | $3,441 | $167,224 | $25,000 | $142,224 |
| 2017 | $3,381 | $164,516 | $25,000 | $139,516 |
| 2016 | $3,381 | $164,516 | $25,000 | $139,516 |
| 2015 | $2,644 | $166,010 | $25,000 | $141,010 |
| 2014 | $2,644 | $160,739 | $25,000 | $135,739 |
Source: Public Records
Map
Nearby Homes
- 6108 Pebble Brook Dr
- 3133 Pleasant Grove Rd
- 3401 Cooper Ln
- 5500 Pleasant Grove Rd
- Lot 1 Blk 2 Cooper Lane Est III
- 6312 Chaparral St
- Lot 1 & Cooper Lane Estates III
- 6605 Chaparral St
- Lot 7 Cooper Lane Est III
- 3608 Melody Ln
- Lot 1 High -Cooper Lane Estate III Dr
- 5703 Forest Grove Rd
- 0 HIGH DRIVE High Dr
- Lot 1 Bl Sylvia Dr
- 24 Windmere Place
- 5619 Deaton Place
- 5617 Deaton Place
- 5616 Deaton Place
- 5703 Sleepy Hollow Ave
- 5614 Deaton Place
- 3423 Garrett Ln
- 3427 Garrett Ln
- 3429 Garrett Ln
- 3421 Garrett Ln
- 0 Garrett Ln
- 3424 Garrett Ln
- 3426 Garrett Ln
- 3431 Garrett Ln
- 3422 Garrett Ln
- 3419 Garrett Ln
- 3420 Garrett Ln
- 3418 Garrett Ln
- 3433 Garrett Ln
- 3417 Garrett Ln
- 3430 Garrett Ln
- 3416 Garrett Ln
- 3435 Garrett Ln
- 3432 Garrett Ln
- 3414 Garrett Ln
- 3701 Pleasant Grove Rd