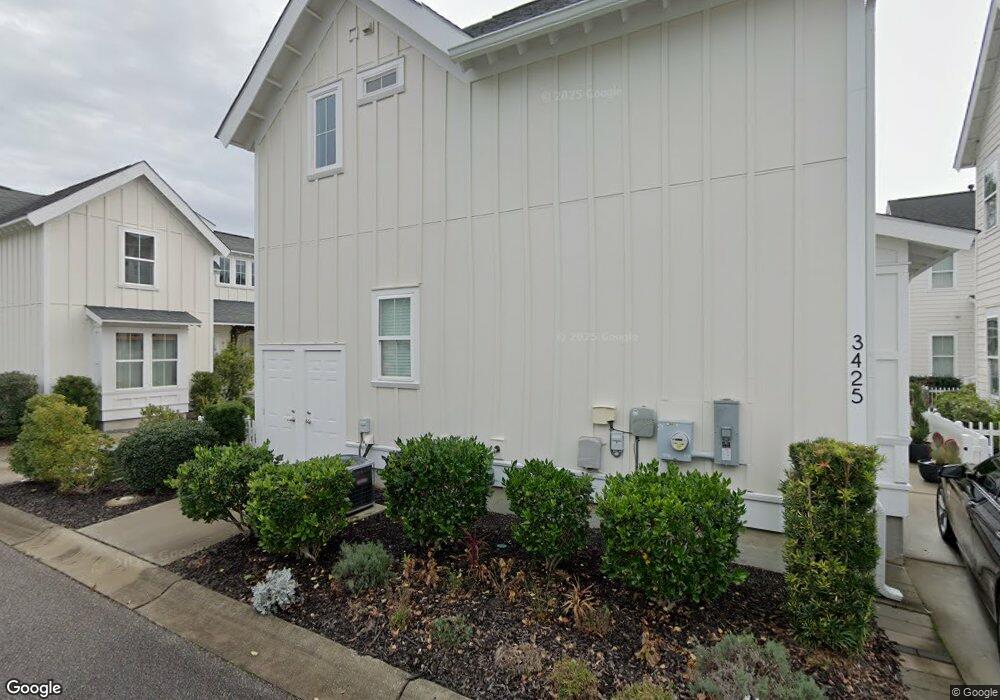
3425 Thrash Way Unit Quarters Myrtle Beach, SC 29577
Market Commons NeighborhoodEstimated Value: $362,000 - $419,000
2
Beds
3
Baths
1,305
Sq Ft
$295/Sq Ft
Est. Value
About This Home
This home is located at 3425 Thrash Way Unit Quarters, Myrtle Beach, SC 29577 and is currently estimated at $385,108, approximately $295 per square foot. 3425 Thrash Way Unit Quarters is a home located in Horry County with nearby schools including Myrtle Beach Child Development Center, Myrtle Beach Primary School, and Myrtle Beach Elementary School.
Ownership History
Date
Name
Owned For
Owner Type
Purchase Details
Closed on
Dec 17, 2019
Sold by
Hogan Jeannie M
Bought by
Minnigh Josie D
Current Estimated Value
Home Financials for this Owner
Home Financials are based on the most recent Mortgage that was taken out on this home.
Original Mortgage
$209,600
Outstanding Balance
$184,793
Interest Rate
3.6%
Mortgage Type
New Conventional
Estimated Equity
$200,315
Purchase Details
Closed on
May 31, 2017
Sold by
Molina Viviana Beatriz
Bought by
Hogan Jeannie M
Home Financials for this Owner
Home Financials are based on the most recent Mortgage that was taken out on this home.
Original Mortgage
$183,200
Interest Rate
4.02%
Mortgage Type
New Conventional
Purchase Details
Closed on
Nov 5, 2015
Sold by
Turner Kurt W
Bought by
Molina Viviana B
Home Financials for this Owner
Home Financials are based on the most recent Mortgage that was taken out on this home.
Original Mortgage
$200,000
Interest Rate
3.78%
Purchase Details
Closed on
Jun 17, 2013
Sold by
Dock Street Communities
Bought by
Turner Kurt W
Create a Home Valuation Report for This Property
The Home Valuation Report is an in-depth analysis detailing your home's value as well as a comparison with similar homes in the area
Home Values in the Area
Average Home Value in this Area
Purchase History
| Date | Buyer | Sale Price | Title Company |
|---|---|---|---|
| Minnigh Josie D | $262,000 | -- | |
| Hogan Jeannie M | $229,000 | -- | |
| Molina Viviana B | $200,000 | -- | |
| Turner Kurt W | $191,862 | -- |
Source: Public Records
Mortgage History
| Date | Status | Borrower | Loan Amount |
|---|---|---|---|
| Open | Minnigh Josie D | $209,600 | |
| Previous Owner | Hogan Jeannie M | $183,200 | |
| Previous Owner | Molina Viviana B | $200,000 |
Source: Public Records
Tax History Compared to Growth
Tax History
| Year | Tax Paid | Tax Assessment Tax Assessment Total Assessment is a certain percentage of the fair market value that is determined by local assessors to be the total taxable value of land and additions on the property. | Land | Improvement |
|---|---|---|---|---|
| 2024 | $1,046 | $14,525 | $5,000 | $9,525 |
| 2023 | $1,046 | $10,198 | $2,850 | $7,348 |
| 2021 | $940 | $10,198 | $2,850 | $7,348 |
| 2020 | $3,943 | $10,198 | $2,850 | $7,348 |
| 2019 | $717 | $9,362 | $2,850 | $6,512 |
| 2018 | $0 | $8,976 | $1,836 | $7,140 |
| 2017 | $614 | $8,040 | $1,836 | $6,204 |
| 2016 | $0 | $8,040 | $1,836 | $6,204 |
| 2015 | -- | $12,960 | $2,754 | $10,206 |
| 2014 | $3,276 | $12,960 | $2,754 | $10,206 |
Source: Public Records
Map
Nearby Homes
- 3448 Baldwin Ln
- 3452 Baldwin Ln
- 3385 Pampas Dr
- 754 Murray Ave
- 3400 Pampas Dr
- 750 Howard Ave Unit E
- 736 Satterwhite Way
- 3523 Chestnut Dr
- 813 Pancho St
- 718 Shine Ave
- 830 Howard Ave Unit D
- 804 Shine Ave
- 3526 Evergreen Way Unit 3526
- 763 Moen Place Unit 763-B
- 3530 Evergreen Way
- 1411 Peterson St
- 800 Curtis Brown Ln
- 780 Gabreski Ln Unit A-2
- 2794 Howard Ave Unit A
- 853 Johnson Ave
- 3425 Thrash Way Unit The Quarters
- 3425 Thrash Way
- 3429 Thrash Way
- 3421 Thrash Way
- 3429 Thrash Way Unit The Colleton
- 3429 Thrash Way
- 3424 Branch St
- 3433 Thrash Way Unit LOT 50 R12
- 3433 Thrash Way
- 3433 Thrash Way Unit Market Common
- 3428 Branch St
- 3419 Pampas Dr Unit Lyford
- 3419 Pampas Dr
- 3420 Branch St Unit Quarters
- 3420 Branch St
- 3423 Pampas Dr Unit The Pennfield
- 3423 Pampas Dr Unit Pennfield
- 3423 Pampas Dr Unit Sweetgrass Square Lo
- 3423 Pampas Dr
- 3433 Thrash Way Unit The Quarters