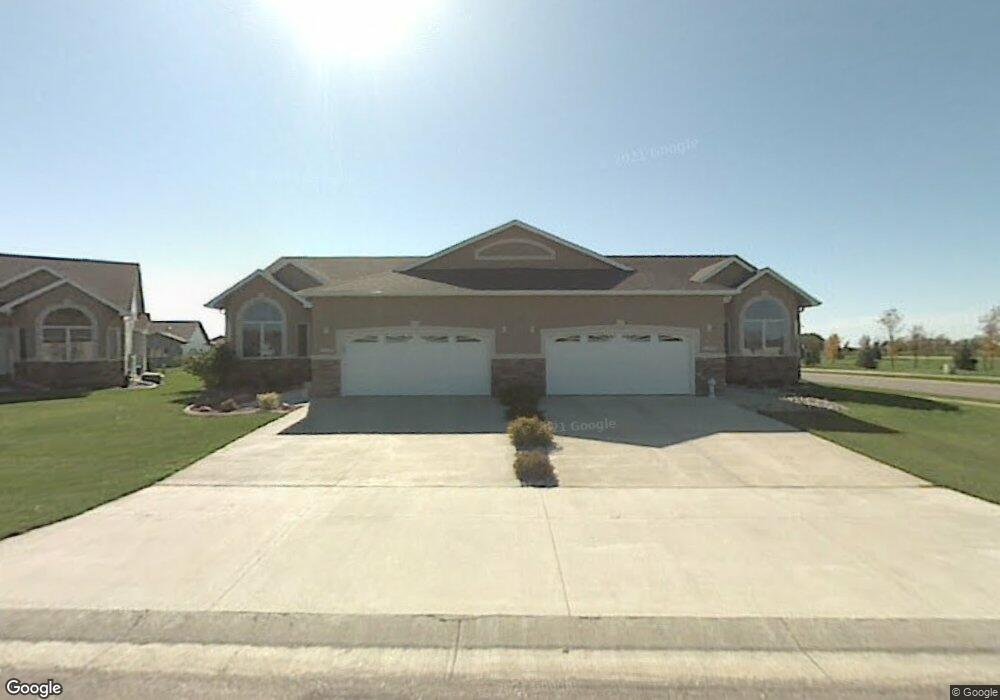
3426 Wheatland Pines Dr S Fargo, ND 58103
Bluemont Lakes NeighborhoodEstimated Value: $359,000 - $427,000
3
Beds
3
Baths
1,460
Sq Ft
$270/Sq Ft
Est. Value
About This Home
This home is located at 3426 Wheatland Pines Dr S, Fargo, ND 58103 and is currently estimated at $393,733, approximately $269 per square foot. 3426 Wheatland Pines Dr S is a home located in Cass County with nearby schools including Ed Clapp Elementary School, Carl Ben Eielson Middle School, and Fargo Davies High School.
Ownership History
Date
Name
Owned For
Owner Type
Purchase Details
Closed on
May 22, 2015
Sold by
Sinner William A and Sinner Cherilyn R
Bought by
Grieve Margaret M
Current Estimated Value
Home Financials for this Owner
Home Financials are based on the most recent Mortgage that was taken out on this home.
Original Mortgage
$110,000
Outstanding Balance
$84,555
Interest Rate
3.62%
Mortgage Type
New Conventional
Estimated Equity
$309,178
Purchase Details
Closed on
Jun 11, 2010
Sold by
Olsen Patrick T and Olsen Paula
Bought by
Sinner William A and Sinner Cherilyn R
Home Financials for this Owner
Home Financials are based on the most recent Mortgage that was taken out on this home.
Original Mortgage
$150,000
Interest Rate
5.13%
Mortgage Type
New Conventional
Create a Home Valuation Report for This Property
The Home Valuation Report is an in-depth analysis detailing your home's value as well as a comparison with similar homes in the area
Home Values in the Area
Average Home Value in this Area
Purchase History
| Date | Buyer | Sale Price | Title Company |
|---|---|---|---|
| Grieve Margaret M | -- | Title Co | |
| Sinner William A | -- | -- |
Source: Public Records
Mortgage History
| Date | Status | Borrower | Loan Amount |
|---|---|---|---|
| Open | Grieve Margaret M | $110,000 | |
| Previous Owner | Sinner William A | $150,000 |
Source: Public Records
Tax History Compared to Growth
Tax History
| Year | Tax Paid | Tax Assessment Tax Assessment Total Assessment is a certain percentage of the fair market value that is determined by local assessors to be the total taxable value of land and additions on the property. | Land | Improvement |
|---|---|---|---|---|
| 2024 | $4,238 | $176,550 | $28,900 | $147,650 |
| 2023 | $4,575 | $171,400 | $28,900 | $142,500 |
| 2022 | $4,045 | $149,050 | $28,900 | $120,150 |
| 2021 | $4,273 | $160,400 | $25,250 | $135,150 |
| 2020 | $3,833 | $145,800 | $25,250 | $120,550 |
| 2019 | $3,837 | $145,800 | $15,800 | $130,000 |
| 2018 | $3,787 | $145,800 | $15,800 | $130,000 |
| 2017 | $4,804 | $141,550 | $15,800 | $125,750 |
| 2016 | $4,427 | $137,450 | $15,800 | $121,650 |
| 2015 | $4,660 | $135,800 | $10,750 | $125,050 |
| 2014 | $4,766 | $135,800 | $10,750 | $125,050 |
| 2013 | $3,807 | $97,600 | $10,750 | $86,850 |
Source: Public Records
Map
Nearby Homes
- 2714 Wheatland Dr S
- 3138 25th Ave S
- 3310 28th Ave S
- 311 Prairiewood Cir S Unit 307
- 2902 24th Ave S
- 3353 30th Ave S
- 2801 26th Ave S
- 2856 28th Ave S
- 3240 30th Ave S
- 2601 24th Ave S
- 3420 17th Ave S Unit B
- 2535 25th St S Unit 204B
- 71 Prairiewood Crossing S Unit B
- 3237 17th Ave S Unit 101
- 2419 25 1 2 Ave S Unit 205
- 3208 16th Ave S
- 3424 Wheatland Pines Dr S
- 3428 Wheatland Pines Dr S
- 3422 Wheatland Pines Dr S
- 3449 26th Ave SW
- 3420 Wheatland Pines Dr S Unit SW
- 3420 Wheatland Pines Dr S
- 3445 26th Ave S
- 3453 26th Ave S
- 3417 Wheatland Pines Dr S
- 3443 26th Ave SW
- 3443 26th Ave S
- 3418 Wheatland Pines Dr S
- 3589 Woodbury Ct S
- 3437 26th Ave SW
- 3415 Wheatland Pines Dr S
- 3416 Wheatland Pines Dr S
- 3588 Woodbury Ct S
- 3414 Wheatland Pines Dr S
- 2527 Parkview Dr S
- 3403 Wheatland Pines Dr S