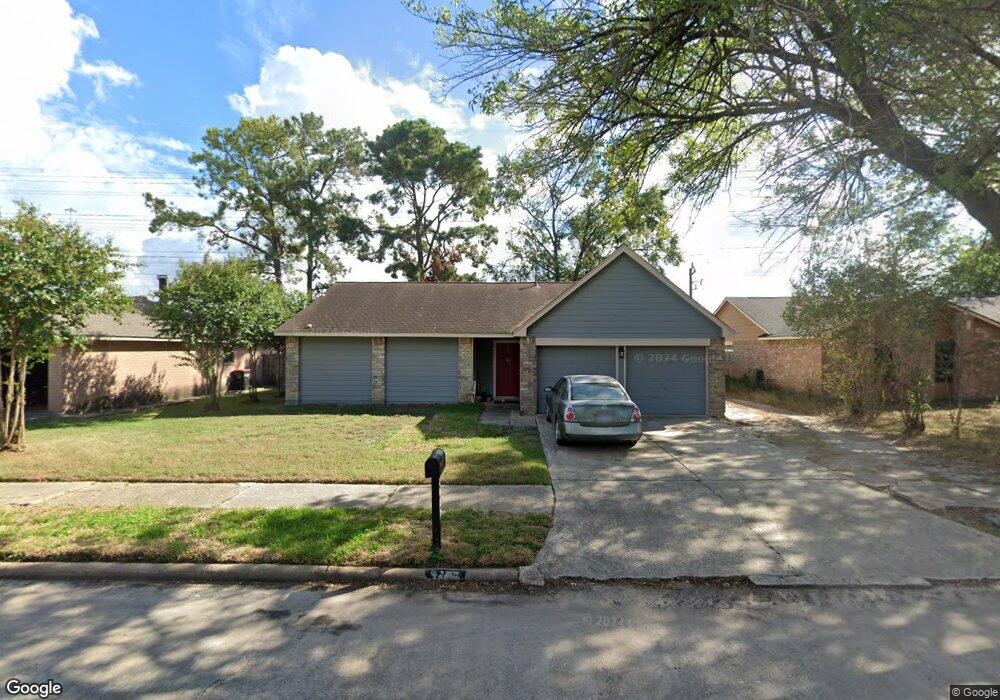
3427 Creek Grove Dr Houston, TX 77066
Champions NeighborhoodEstimated Value: $196,000 - $219,000
3
Beds
2
Baths
1,179
Sq Ft
$174/Sq Ft
Est. Value
About This Home
This home is located at 3427 Creek Grove Dr, Houston, TX 77066 and is currently estimated at $205,424, approximately $174 per square foot. 3427 Creek Grove Dr is a home located in Harris County with nearby schools including Griggs EC/PK/K, Conley Elementary School, and Plummer Middle School.
Ownership History
Date
Name
Owned For
Owner Type
Purchase Details
Closed on
Jan 25, 2025
Sold by
Martinez Jose Valente
Bought by
Martinez Maria Gloria
Current Estimated Value
Purchase Details
Closed on
Feb 11, 2005
Sold by
Martinez Marilen
Bought by
Martinez Maria Gloria and Martinez Jose Valente
Purchase Details
Closed on
Oct 21, 2004
Sold by
Briarcreek Homeowners Assn
Bought by
Martinez Marilen
Purchase Details
Closed on
Dec 8, 2000
Sold by
Martinez Marilen
Bought by
Briarcreek Homeowners Assn Inc
Purchase Details
Closed on
Jul 15, 1997
Sold by
Kopernik Edward A and Kopernik Kathy L
Bought by
Martinez Marilen
Home Financials for this Owner
Home Financials are based on the most recent Mortgage that was taken out on this home.
Original Mortgage
$50,485
Interest Rate
7.85%
Mortgage Type
FHA
Purchase Details
Closed on
Oct 27, 1994
Sold by
Kopernik Kathy Lee
Bought by
Kopernik Edward A
Create a Home Valuation Report for This Property
The Home Valuation Report is an in-depth analysis detailing your home's value as well as a comparison with similar homes in the area
Home Values in the Area
Average Home Value in this Area
Purchase History
| Date | Buyer | Sale Price | Title Company |
|---|---|---|---|
| Martinez Maria Gloria | -- | None Listed On Document | |
| Martinez Maria Gloria | -- | American Title Co | |
| Martinez Marilen | -- | -- | |
| Briarcreek Homeowners Assn Inc | $2,000 | -- | |
| Martinez Marilen | -- | -- | |
| Kopernik Edward A | -- | -- | |
| Kopernik Edward A | -- | -- |
Source: Public Records
Mortgage History
| Date | Status | Borrower | Loan Amount |
|---|---|---|---|
| Previous Owner | Martinez Marilen | $50,485 |
Source: Public Records
Tax History Compared to Growth
Tax History
| Year | Tax Paid | Tax Assessment Tax Assessment Total Assessment is a certain percentage of the fair market value that is determined by local assessors to be the total taxable value of land and additions on the property. | Land | Improvement |
|---|---|---|---|---|
| 2025 | $4,850 | $188,453 | $37,808 | $150,645 |
| 2024 | $4,850 | $194,408 | $37,808 | $156,600 |
| 2023 | $4,850 | $216,505 | $37,808 | $178,697 |
| 2022 | $4,916 | $185,096 | $24,874 | $160,222 |
| 2021 | $4,281 | $152,060 | $24,874 | $127,186 |
| 2020 | $4,318 | $141,036 | $24,874 | $116,162 |
| 2019 | $3,824 | $119,910 | $13,266 | $106,644 |
| 2018 | $1,541 | $107,346 | $13,266 | $94,080 |
| 2017 | $3,324 | $107,346 | $13,266 | $94,080 |
| 2016 | $3,324 | $107,346 | $13,266 | $94,080 |
| 2015 | $2,074 | $94,524 | $13,266 | $81,258 |
| 2014 | $2,074 | $65,826 | $13,266 | $52,560 |
Source: Public Records
Map
Nearby Homes
- 14207 Timberhaven Dr
- 14118 Magnolia Springs Dr
- 14003 Valley Grove Dr
- 3407 Sandbrook Dr
- 3240 Brownie Campbell Rd
- 13610 Kaltenbrun Rd
- 13803 Bearwood Rd
- 3519 Hombly Rd
- 13518 Kaltenbrun Rd
- 11322 Yorklyn Dr
- 2919 Sunwood Dr
- 3230 Hombly Rd
- 11335 Chelsea Walk Dr
- 6610 Northleaf Dr
- 11009 Panicum Ct
- 11427 Valarno Dr
- 10522 Northview Dr
- 2606 Owens Cross Dr
- 11021 Crenchrus Ct
- 10915 Meadow Walk Ln
- 3431 Creek Grove Dr
- 3423 Creek Grove Dr
- 3419 Creek Grove Dr
- 3435 Creek Grove Dr
- 3426 Creek Grove Dr
- 3430 Creek Grove Dr
- 3422 Creek Grove Dr
- 3415 Creek Grove Dr
- 3418 Creek Grove Dr
- 14003 Timberhaven Dr
- 14007 Timberhaven Dr
- 3414 Creek Grove Dr
- 3435 Willow Tree Dr
- 3411 Creek Grove Dr
- 3439 Willow Tree Dr
- 3431 Willow Tree Dr
- 14011 Timberhaven Dr
- 3410 Creek Grove Dr
- 3427 Willow Tree Dr
- 3407 Creek Grove Dr