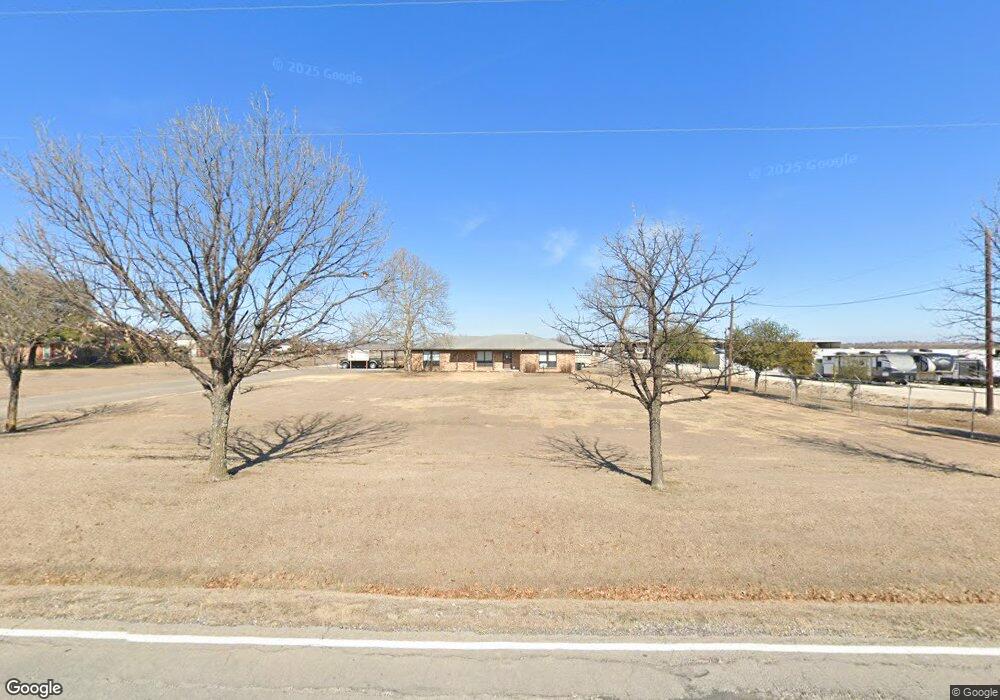
3428 N Masch Branch Rd Denton, TX 76207
Estimated Value: $342,823 - $692,000
3
Beds
1
Bath
1,362
Sq Ft
$323/Sq Ft
Est. Value
About This Home
This home is located at 3428 N Masch Branch Rd, Denton, TX 76207 and is currently estimated at $439,956, approximately $323 per square foot. 3428 N Masch Branch Rd is a home located in Denton County with nearby schools including Krum Early Education Center, Blanche Dodd Intermediate School, and Krum Middle School.
Ownership History
Date
Name
Owned For
Owner Type
Purchase Details
Closed on
Mar 28, 2001
Sold by
Parson Joe Dan and Parson Cynthia
Bought by
Naus Steven and Naus Sandra
Current Estimated Value
Home Financials for this Owner
Home Financials are based on the most recent Mortgage that was taken out on this home.
Original Mortgage
$180,500
Outstanding Balance
$66,341
Interest Rate
6.98%
Mortgage Type
Purchase Money Mortgage
Estimated Equity
$373,615
Purchase Details
Closed on
Jun 4, 1997
Sold by
Sater Alvrone
Bought by
Parson Joe Dan
Home Financials for this Owner
Home Financials are based on the most recent Mortgage that was taken out on this home.
Original Mortgage
$30,000
Interest Rate
7.98%
Mortgage Type
Purchase Money Mortgage
Purchase Details
Closed on
Apr 25, 1995
Sold by
Adams Garland H and Adams Dottie Faye
Bought by
Parson Joe Dan
Home Financials for this Owner
Home Financials are based on the most recent Mortgage that was taken out on this home.
Original Mortgage
$89,550
Interest Rate
8.34%
Mortgage Type
Purchase Money Mortgage
Create a Home Valuation Report for This Property
The Home Valuation Report is an in-depth analysis detailing your home's value as well as a comparison with similar homes in the area
Home Values in the Area
Average Home Value in this Area
Purchase History
| Date | Buyer | Sale Price | Title Company |
|---|---|---|---|
| Naus Steven | -- | -- | |
| Parson Joe Dan | -- | First American Title Ins | |
| Parson Joe Dan | -- | First American Title Ins |
Source: Public Records
Mortgage History
| Date | Status | Borrower | Loan Amount |
|---|---|---|---|
| Open | Naus Steven | $180,500 | |
| Previous Owner | Parson Joe Dan | $30,000 | |
| Previous Owner | Parson Joe Dan | $89,550 |
Source: Public Records
Tax History Compared to Growth
Tax History
| Year | Tax Paid | Tax Assessment Tax Assessment Total Assessment is a certain percentage of the fair market value that is determined by local assessors to be the total taxable value of land and additions on the property. | Land | Improvement |
|---|---|---|---|---|
| 2025 | $384 | $182,174 | $101,018 | $81,156 |
| 2024 | $3,326 | $166,051 | $0 | $0 |
| 2023 | $384 | $150,969 | $96,021 | $127,889 |
| 2022 | $3,014 | $137,260 | $32,880 | $144,228 |
| 2021 | $2,696 | $124,771 | $21,879 | $102,892 |
| 2020 | $2,605 | $117,999 | $21,885 | $98,812 |
| 2019 | $2,560 | $122,083 | $21,905 | $100,178 |
| 2018 | $2,357 | $97,573 | $21,915 | $75,658 |
| 2017 | $2,478 | $100,257 | $21,915 | $78,342 |
| 2016 | $2,260 | $91,566 | $21,935 | $69,631 |
| 2015 | -- | $83,139 | $15,526 | $67,613 |
| 2013 | -- | $74,273 | $15,486 | $58,787 |
Source: Public Records
Map
Nearby Homes
- 4574 Masch Branch Rd
- 328 Broken Bow
- 1155 Cottonwood Ln
- 2001 N Lariat Rd
- 1627 Kawati Way
- 8540 W University Dr
- 1620 Kawati Way
- 1401 N Masch Branch Rd
- 334 Saddlebrook Dr
- 2007 Cindy Ln
- 2309 Hillview Dr
- 1623 Withers Way
- ESTERO Plan at Hickory Grove
- EASTON Plan at Hickory Grove
- DALTON Plan at Hickory Grove
- CAPROCK Plan at Hickory Grove
- elgin Plan at Hickory Grove
- BARTON Plan at Hickory Grove
- lakeway Plan at Hickory Grove
- BAXTER Plan at Hickory Grove
- 3472 N Masch Branch Rd
- 3500 N Masch Branch Rd
- 3288 N Masch Branch Rd
- 4728 Miller Rd
- 4690 Miller Rd
- 4630 Miller Rd
- 0000 Masch Branch Rd
- 4672 Miller Rd
- 4610 Miller Rd
- 4570 Miller Rd
- 4731 Miller Rd
- 4695 Miller Rd
- None Miller Rd
- 4675 Miller Rd
- 3765 Masch Branch Rd
- 0 Darby Smith Rd
- 4645 Miller Rd
- 408 8th St
- 1856 Darby Smith Rd
- 4540 Miller Rd