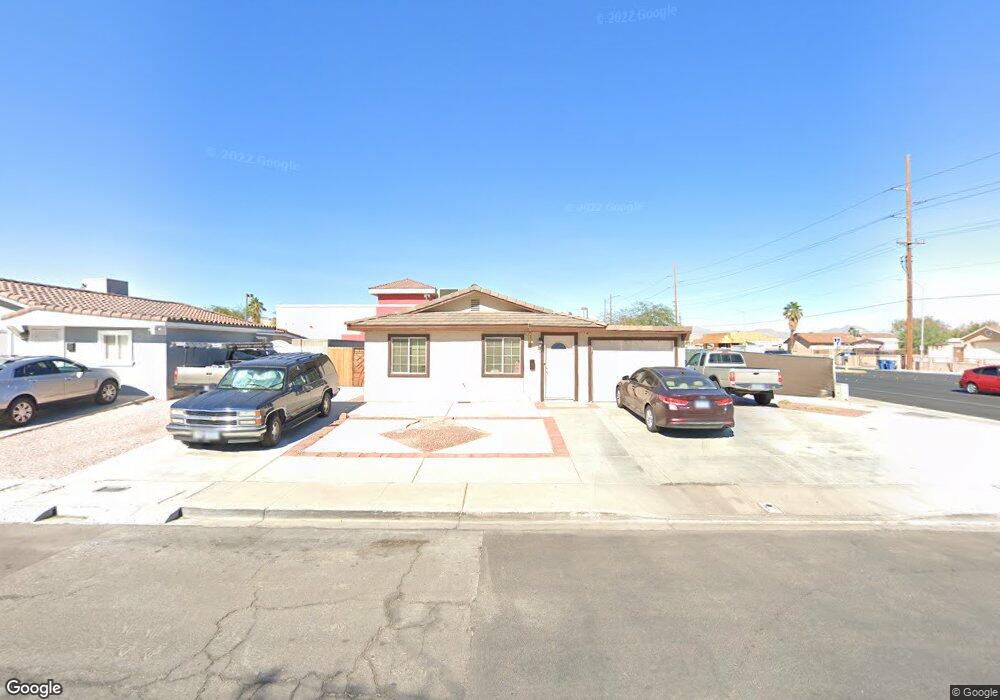
3428 Shore Ave North Las Vegas, NV 89030
Estimated Value: $308,000 - $349,000
3
Beds
2
Baths
1,104
Sq Ft
$294/Sq Ft
Est. Value
About This Home
This home is located at 3428 Shore Ave, North Las Vegas, NV 89030 and is currently estimated at $324,635, approximately $294 per square foot. 3428 Shore Ave is a home located in Clark County with nearby schools including Lois Craig Elementary School, Marvin M Sedway Middle School, and Canyon Springs High School And The Leadership And.
Ownership History
Date
Name
Owned For
Owner Type
Purchase Details
Closed on
Apr 11, 2022
Sold by
Busbee Gary A
Bought by
Montalvan Sergio
Current Estimated Value
Home Financials for this Owner
Home Financials are based on the most recent Mortgage that was taken out on this home.
Original Mortgage
$275,500
Outstanding Balance
$257,408
Interest Rate
3.76%
Mortgage Type
New Conventional
Estimated Equity
$67,227
Purchase Details
Closed on
Feb 26, 2014
Sold by
Escandon Properties Inc
Bought by
Busbee Gary A
Home Financials for this Owner
Home Financials are based on the most recent Mortgage that was taken out on this home.
Original Mortgage
$74,900
Interest Rate
4.34%
Mortgage Type
New Conventional
Purchase Details
Closed on
Dec 30, 2010
Sold by
Fannie Mae
Bought by
Escandon Properties Inc
Purchase Details
Closed on
Aug 3, 2010
Sold by
Martin Jimmie Roger
Bought by
Federal National Mortgage Association
Create a Home Valuation Report for This Property
The Home Valuation Report is an in-depth analysis detailing your home's value as well as a comparison with similar homes in the area
Home Values in the Area
Average Home Value in this Area
Purchase History
| Date | Buyer | Sale Price | Title Company |
|---|---|---|---|
| Montalvan Sergio | $305,000 | Wfg National Title | |
| Busbee Gary A | $104,000 | Fidelity National Title | |
| Escandon Properties Inc | $38,000 | Stewart Title Las Vegas War | |
| Federal National Mortgage Association | $45,000 | Accommodation |
Source: Public Records
Mortgage History
| Date | Status | Borrower | Loan Amount |
|---|---|---|---|
| Open | Montalvan Sergio | $275,500 | |
| Previous Owner | Busbee Gary A | $74,900 |
Source: Public Records
Tax History Compared to Growth
Tax History
| Year | Tax Paid | Tax Assessment Tax Assessment Total Assessment is a certain percentage of the fair market value that is determined by local assessors to be the total taxable value of land and additions on the property. | Land | Improvement |
|---|---|---|---|---|
| 2025 | $660 | $39,160 | $24,500 | $14,660 |
| 2024 | $641 | $39,160 | $24,500 | $14,660 |
| 2023 | $641 | $41,417 | $27,300 | $14,117 |
| 2022 | $622 | $35,661 | $22,400 | $13,261 |
| 2021 | $604 | $30,523 | $17,500 | $13,023 |
| 2020 | $584 | $30,814 | $17,500 | $13,314 |
| 2019 | $567 | $27,433 | $14,000 | $13,433 |
| 2018 | $550 | $26,040 | $12,863 | $13,177 |
| 2017 | $809 | $24,131 | $10,500 | $13,631 |
| 2016 | $522 | $20,965 | $6,650 | $14,315 |
| 2015 | $520 | $15,390 | $3,850 | $11,540 |
| 2014 | $505 | $16,143 | $3,850 | $12,293 |
Source: Public Records
Map
Nearby Homes
- 3501 Orvis St
- 3540 Purdue
- 3630 Three Bars Ct
- 3508 Rio Robles Dr Unit D
- 3508 Rio Robles Dr Unit C
- 3508 Rio Robles Dr Unit A
- 3327 Rio Grande St
- 3429 E Cheyenne Ave
- 3401 N Walnut Rd Unit 330
- 3401 N Walnut Rd Unit 121
- 3401 N Walnut Rd Unit 113
- 3401 N Walnut Rd Unit 109
- 3401 N Walnut Rd Unit 388
- 3401 N Walnut Rd Unit 235
- 3401 N Walnut Rd Unit 15
- 3401 N Walnut Rd Unit 236
- 3401 N Walnut Rd Unit 74
- 3401 N Walnut Rd Unit 13
- 3401 N Walnut Rd Unit 6
- 3401 N Walnut Rd Unit 402
- 3424 Shore Ave
- 3420 Shore Ave Unit 5A
- 3429 Shore Ave
- 3425 Shore Ave Unit 5A
- 3421 Shore Ave
- 3520 N Pecos Rd
- 3512 Orvis St
- 3416 Shore Ave
- 3540 N Pecos Rd
- 3516 Orvis St
- 3417 Shore Ave
- 3550 N Pecos Rd
- 3428 Siler Ave
- 3424 Siler Ave
- 3520 Orvis St
- 3420 Siler Ave
- 3413 Shore Ave
- 3560 N Pecos Rd
- 3490 N Pecos Rd
- 3511 Marquette Dr