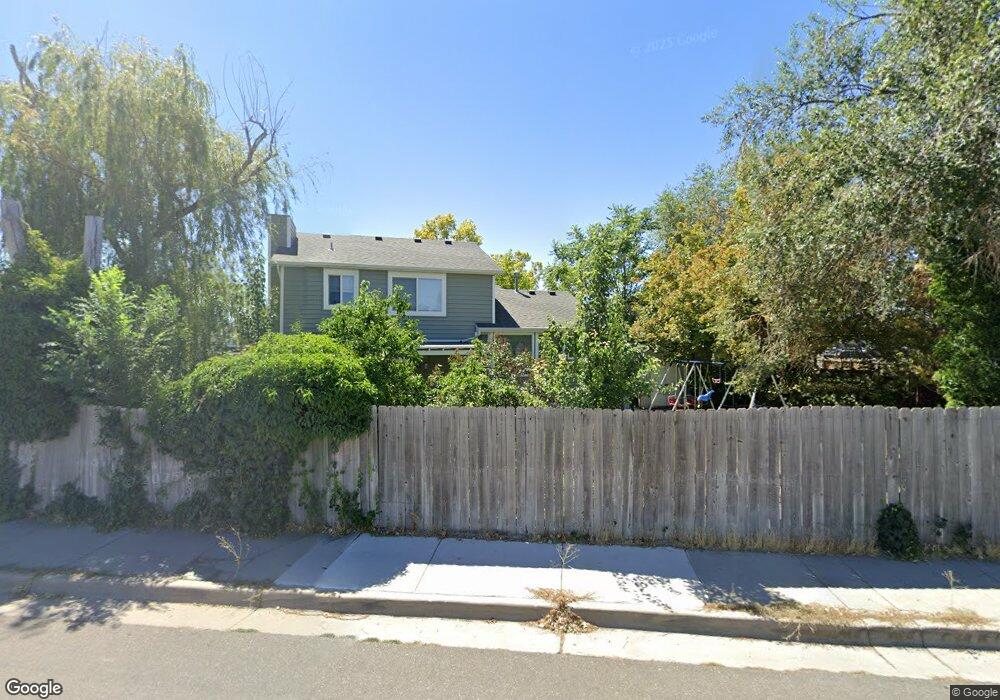
3428 W 7800 S West Jordan, UT 84088
Estimated Value: $487,000 - $545,000
4
Beds
3
Baths
1,411
Sq Ft
$362/Sq Ft
Est. Value
About This Home
This home is located at 3428 W 7800 S, West Jordan, UT 84088 and is currently estimated at $511,436, approximately $362 per square foot. 3428 W 7800 S is a home located in Salt Lake County with nearby schools including Columbia Elementary School, Joel P. Jensen Middle School, and West Jordan High School.
Ownership History
Date
Name
Owned For
Owner Type
Purchase Details
Closed on
Nov 6, 2012
Sold by
Mclelland Michael Shane and Mclelland Janet L
Bought by
Pierce Lindsey R
Current Estimated Value
Home Financials for this Owner
Home Financials are based on the most recent Mortgage that was taken out on this home.
Original Mortgage
$4,590
Outstanding Balance
$3,167
Interest Rate
3.36%
Mortgage Type
Stand Alone Second
Estimated Equity
$508,269
Purchase Details
Closed on
Jul 30, 1996
Sold by
Dickson Robert W and Dickson Cathy L
Bought by
Mclelland Michael Shane and Mclelland Janet L
Home Financials for this Owner
Home Financials are based on the most recent Mortgage that was taken out on this home.
Original Mortgage
$125,831
Interest Rate
8.32%
Mortgage Type
FHA
Create a Home Valuation Report for This Property
The Home Valuation Report is an in-depth analysis detailing your home's value as well as a comparison with similar homes in the area
Home Values in the Area
Average Home Value in this Area
Purchase History
| Date | Buyer | Sale Price | Title Company |
|---|---|---|---|
| Pierce Lindsey R | -- | First American Title Co Llc | |
| Mclelland Michael Shane | -- | -- |
Source: Public Records
Mortgage History
| Date | Status | Borrower | Loan Amount |
|---|---|---|---|
| Open | Pierce Lindsey R | $4,590 | |
| Open | Pierce Lindsey R | $184,594 | |
| Previous Owner | Mclelland Michael Shane | $125,831 |
Source: Public Records
Tax History Compared to Growth
Tax History
| Year | Tax Paid | Tax Assessment Tax Assessment Total Assessment is a certain percentage of the fair market value that is determined by local assessors to be the total taxable value of land and additions on the property. | Land | Improvement |
|---|---|---|---|---|
| 2025 | $2,233 | $436,000 | $93,300 | $342,700 |
| 2024 | $2,233 | $429,700 | $91,600 | $338,100 |
| 2023 | $2,380 | $431,500 | $88,000 | $343,500 |
| 2022 | $2,465 | $439,800 | $86,300 | $353,500 |
| 2021 | $2,044 | $331,900 | $61,500 | $270,400 |
| 2020 | $1,967 | $299,800 | $61,500 | $238,300 |
| 2019 | $1,961 | $293,000 | $61,500 | $231,500 |
| 2018 | $1,783 | $264,300 | $59,100 | $205,200 |
| 2017 | $1,594 | $235,300 | $59,100 | $176,200 |
| 2016 | $1,496 | $207,400 | $59,100 | $148,300 |
| 2015 | $1,437 | $194,300 | $60,200 | $134,100 |
| 2014 | $1,466 | $195,100 | $61,400 | $133,700 |
Source: Public Records
Map
Nearby Homes
- 3476 W Spaulding Rd
- 3354 W 7800 S
- 3546 W 7980 S
- 3422 Briar Dr
- 3629 W 7825 S
- 3647 W 7865 S
- 8058 S Lismore Ln Unit 304
- 3332 Lower Newark Way
- 7611 S Springbrook Dr
- 7989 S 3725 W
- 7991 S 3725 W
- 3165 W 7720 S
- 8180 S Old Bingham Hwy
- 3066 W Linton Dr
- 7604 S Autumn Dr
- 7987 S 2980 W
- 7721 Sunset Cir
- 2886 W 7550 S
- 7942 S 2800 W
- 3112 Green Acre Dr
- 3442 W Beckford Cir
- 3446 W Beckford Cir
- 3446 Beckford Cir
- 3436 W Beckford Cir
- 3447 Beckford Cir
- 3428 Beckford Cir
- 3443 Beckford Cir
- 3437 Beckford Cir
- 3437 W Beckford Cir
- 3436 W 7800 S
- 3429 Beckford Cir
- 7783 Woodgreen Rd
- 3444 Charlesworth Cir
- 3438 W Charlesworth Cir
- 3438 Charlesworth Cir
- 7813 Palladium Dr
- 7821 S Palladium Dr
- 7821 Palladium Dr
- 3448 W Charlesworth Cir
- 3448 Charlesworth Cir