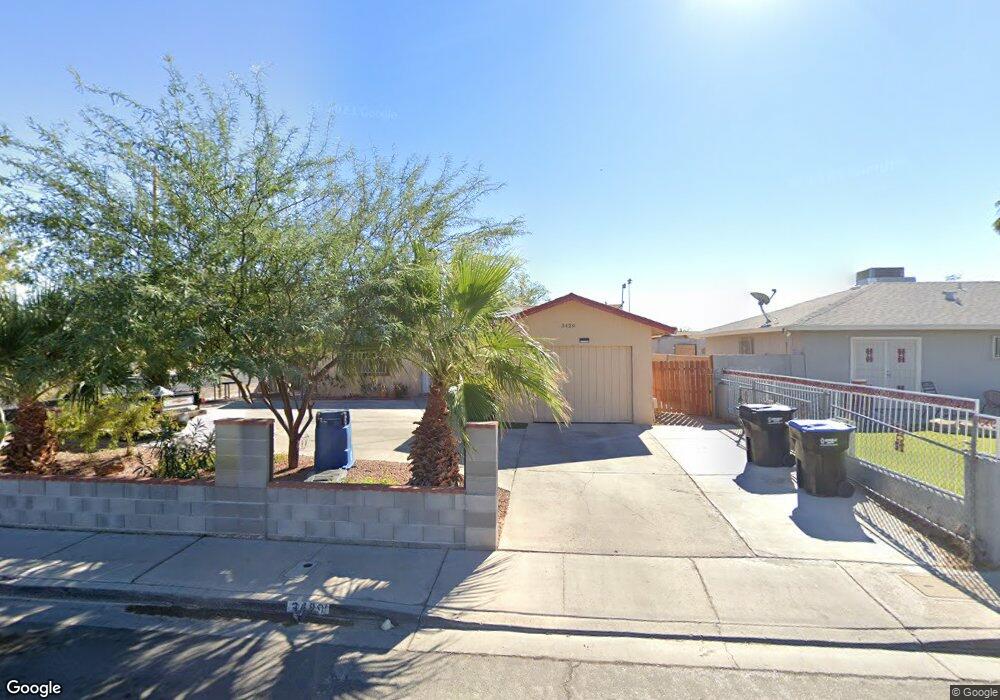
3429 Blake Ave North Las Vegas, NV 89030
Estimated Value: $315,652 - $396,000
4
Beds
2
Baths
1,411
Sq Ft
$250/Sq Ft
Est. Value
About This Home
This home is located at 3429 Blake Ave, North Las Vegas, NV 89030 and is currently estimated at $352,913, approximately $250 per square foot. 3429 Blake Ave is a home located in Clark County with nearby schools including Lois Craig Elementary School, Marvin M Sedway Middle School, and Canyon Springs High School And The Leadership And.
Ownership History
Date
Name
Owned For
Owner Type
Purchase Details
Closed on
Feb 26, 2014
Sold by
Campos Carlos M
Bought by
Cisneros Blanca Campos
Current Estimated Value
Purchase Details
Closed on
May 25, 2004
Sold by
Franco Delia G and Arteaga Delia G
Bought by
Cisneros Blanca Campos and Campos Carlos M
Home Financials for this Owner
Home Financials are based on the most recent Mortgage that was taken out on this home.
Original Mortgage
$126,900
Outstanding Balance
$61,450
Interest Rate
5.86%
Mortgage Type
Unknown
Estimated Equity
$291,463
Purchase Details
Closed on
Jun 26, 1996
Sold by
Arteaga Delia G
Bought by
Arteaga Delia G
Home Financials for this Owner
Home Financials are based on the most recent Mortgage that was taken out on this home.
Original Mortgage
$48,000
Interest Rate
8.09%
Purchase Details
Closed on
Jun 30, 1994
Sold by
Arteaga Luciano V
Bought by
Arteaga Delia G
Create a Home Valuation Report for This Property
The Home Valuation Report is an in-depth analysis detailing your home's value as well as a comparison with similar homes in the area
Home Values in the Area
Average Home Value in this Area
Purchase History
| Date | Buyer | Sale Price | Title Company |
|---|---|---|---|
| Cisneros Blanca Campos | $50,000 | None Available | |
| Cisneros Blanca Campos | $126,900 | Equity Title Of Nevada | |
| Franco Delia G | -- | Equity Title Of Nevada | |
| Arteaga Delia G | -- | Nevada Title Company | |
| Arteaga Delia G | -- | -- |
Source: Public Records
Mortgage History
| Date | Status | Borrower | Loan Amount |
|---|---|---|---|
| Open | Cisneros Blanca Campos | $126,900 | |
| Previous Owner | Arteaga Delia G | $48,000 |
Source: Public Records
Tax History Compared to Growth
Tax History
| Year | Tax Paid | Tax Assessment Tax Assessment Total Assessment is a certain percentage of the fair market value that is determined by local assessors to be the total taxable value of land and additions on the property. | Land | Improvement |
|---|---|---|---|---|
| 2025 | $1,048 | $55,239 | $24,500 | $30,739 |
| 2024 | $971 | $55,239 | $24,500 | $30,739 |
| 2023 | $971 | $42,678 | $27,300 | $15,378 |
| 2022 | $737 | $36,094 | $22,400 | $13,694 |
| 2021 | $683 | $30,261 | $17,500 | $12,761 |
| 2020 | $631 | $30,620 | $17,500 | $13,120 |
| 2019 | $556 | $26,339 | $14,000 | $12,339 |
| 2018 | $531 | $24,454 | $12,250 | $12,204 |
| 2017 | $778 | $23,200 | $10,500 | $12,700 |
| 2016 | $498 | $20,152 | $6,650 | $13,502 |
| 2015 | $496 | $14,789 | $3,850 | $10,939 |
| 2014 | $480 | $15,426 | $3,850 | $11,576 |
Source: Public Records
Map
Nearby Homes
- 3501 Orvis St
- 3327 Rio Grande St
- 3540 Purdue
- 3508 Rio Robles Dr Unit D
- 3508 Rio Robles Dr Unit C
- 3508 Rio Robles Dr Unit A
- 3630 Three Bars Ct
- 3429 E Cheyenne Ave
- 3401 N Walnut Rd Unit 330
- 3401 N Walnut Rd Unit 121
- 3401 N Walnut Rd Unit 113
- 3401 N Walnut Rd Unit 109
- 3401 N Walnut Rd Unit 388
- 3401 N Walnut Rd Unit 235
- 3401 N Walnut Rd Unit 15
- 3401 N Walnut Rd Unit 236
- 3401 N Walnut Rd Unit 74
- 3401 N Walnut Rd Unit 13
- 3401 N Walnut Rd Unit 6
- 3401 N Walnut Rd Unit 402
- 3425 Blake Ave
- 3428 E Colton Ave
- 3424 E Colton Ave
- 3421 Blake Ave
- 3428 Blake Ave
- 3420 E Colton Ave
- 3424 Blake Ave Unit 5C
- 3417 Blake Ave
- 3420 Blake Ave
- 3416 E Colton Ave
- 3416 Blake Ave
- 3413 Blake Ave
- 3429 Siler Ave
- 3412 E Colton Ave
- 3425 Siler Ave
- 3421 Siler Ave
- 3412 Blake Ave
- 3409 Blake Ave
- 3443 Marquette Dr
- 3417 Siler Ave