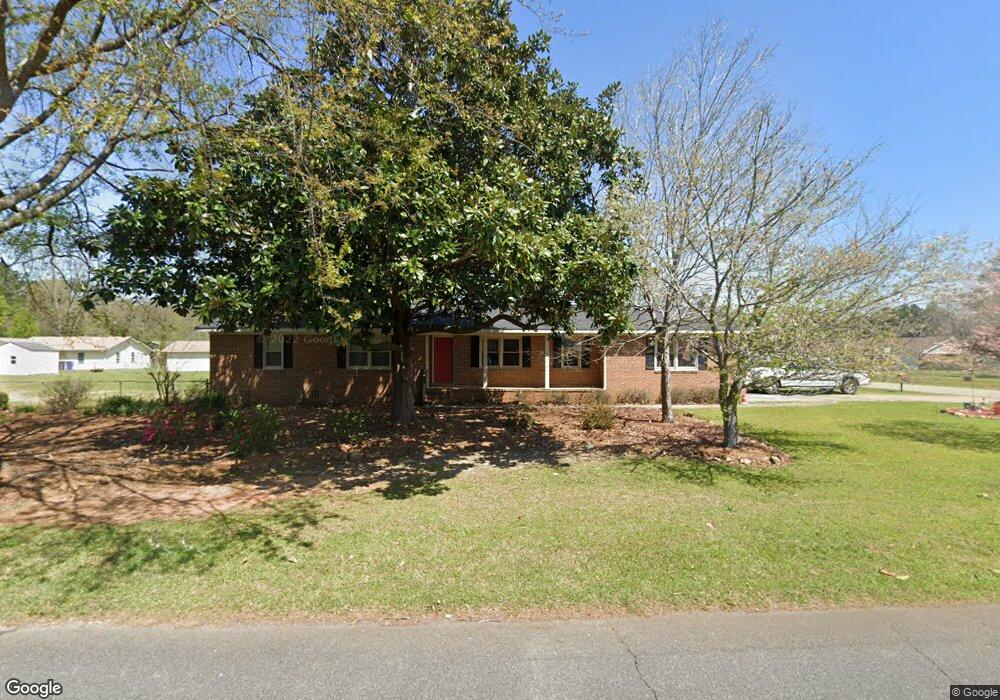
3429 Sandy Cir Macon, GA 31216
Estimated Value: $208,093 - $239,000
3
Beds
2
Baths
1,658
Sq Ft
$136/Sq Ft
Est. Value
About This Home
This home is located at 3429 Sandy Cir, Macon, GA 31216 and is currently estimated at $225,773, approximately $136 per square foot. 3429 Sandy Cir is a home located in Bibb County with nearby schools including Porter Elementary School, Rutland Middle School, and Rutland High School.
Ownership History
Date
Name
Owned For
Owner Type
Purchase Details
Closed on
Jul 30, 1971
Sold by
Mrs Roy C Swymer
Bought by
Price Richard A - Bonnie
Current Estimated Value
Create a Home Valuation Report for This Property
The Home Valuation Report is an in-depth analysis detailing your home's value as well as a comparison with similar homes in the area
Home Values in the Area
Average Home Value in this Area
Purchase History
| Date | Buyer | Sale Price | Title Company |
|---|---|---|---|
| Price Richard A - Bonnie | $1,000 | -- |
Source: Public Records
Tax History Compared to Growth
Tax History
| Year | Tax Paid | Tax Assessment Tax Assessment Total Assessment is a certain percentage of the fair market value that is determined by local assessors to be the total taxable value of land and additions on the property. | Land | Improvement |
|---|---|---|---|---|
| 2025 | $973 | $54,195 | $10,000 | $44,195 |
| 2024 | $1,008 | $54,147 | $10,000 | $44,147 |
| 2023 | $551 | $54,147 | $10,000 | $44,147 |
| 2022 | $1,673 | $62,232 | $7,532 | $54,700 |
| 2021 | $1,955 | $58,451 | $7,532 | $50,919 |
| 2020 | $1,998 | $58,451 | $7,532 | $50,919 |
| 2019 | $1,579 | $47,335 | $6,847 | $40,488 |
| 2018 | $2,210 | $40,866 | $6,847 | $34,019 |
| 2017 | $1,383 | $43,907 | $6,847 | $37,060 |
| 2016 | $1,277 | $43,907 | $6,847 | $37,060 |
| 2015 | $1,808 | $43,907 | $6,847 | $37,060 |
| 2014 | $1,811 | $43,907 | $6,847 | $37,060 |
Source: Public Records
Map
Nearby Homes
- 5787 Sorrell Dr
- 3441 Sandy Cir
- 5788 Mechille Dr
- 5779 Sorrell Dr
- 3389 Sandy Cir
- 3430 Sandy Cir
- 5780 Mechille Dr
- 3414 Sandy Cir
- 3440 Sandy Cir
- 5790 Sorrell Dr
- 0 Sorrell Dr Unit 7155743
- 0 Sorrell Dr Unit 8097938
- 3450 Sandy Cir
- 5769 Sorrell Dr
- 5770 Mechille Dr
- 3390 Sandy Cir
- 3451 Sandy Cir
- 5780 Sorrell Dr
- 5791 Mechille Dr
- 3468 Sandy Cir