Estimated Value: $498,456 - $516,000
4
Beds
3
Baths
1,839
Sq Ft
$275/Sq Ft
Est. Value
About This Home
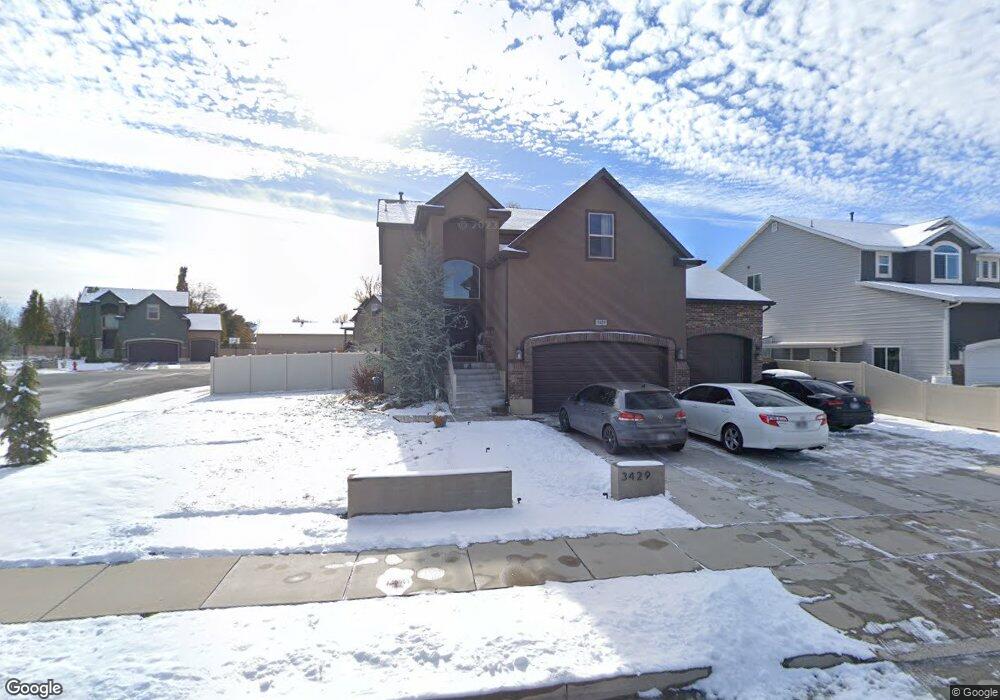
This home is located at 3429 W 5125 S, Roy, UT 84067 and is currently estimated at $506,614, approximately $275 per square foot. 3429 W 5125 S is a home with nearby schools including Midland School, Sand Ridge Junior High School, and Roy High School.
Ownership History
Date
Name
Owned For
Owner Type
Purchase Details
Closed on
Dec 23, 2019
Sold by
Lawson John D and Lawson Brigette L
Bought by
Lawson John and Lawson Brigette
Current Estimated Value
Home Financials for this Owner
Home Financials are based on the most recent Mortgage that was taken out on this home.
Original Mortgage
$262,000
Outstanding Balance
$231,442
Interest Rate
3.7%
Mortgage Type
New Conventional
Estimated Equity
$275,172
Purchase Details
Closed on
Aug 14, 2013
Sold by
Scott Lindsay Construction Inc
Bought by
Lawson John D and Lawson Brigette L
Home Financials for this Owner
Home Financials are based on the most recent Mortgage that was taken out on this home.
Original Mortgage
$239,031
Interest Rate
4.28%
Mortgage Type
VA
Purchase Details
Closed on
May 8, 2013
Sold by
Ivins Kevin
Bought by
Scott Lindsay Construction Inc
Purchase Details
Closed on
May 3, 2013
Sold by
Andrews Acres Llc
Bought by
Ivins Kevin
Create a Home Valuation Report for This Property
The Home Valuation Report is an in-depth analysis detailing your home's value as well as a comparison with similar homes in the area
Home Values in the Area
Average Home Value in this Area
Purchase History
| Date | Buyer | Sale Price | Title Company |
|---|---|---|---|
| Lawson John | -- | First American Foothill | |
| Lawson John D | -- | Intermountain Title | |
| Scott Lindsay Construction Inc | -- | Intermountain Title | |
| Ivins Kevin | -- | Mountain View Title Ogden | |
| Andrews Acres Llc | -- | Mountain View Title Ogden |
Source: Public Records
Mortgage History
| Date | Status | Borrower | Loan Amount |
|---|---|---|---|
| Open | Lawson John | $262,000 | |
| Closed | Lawson John D | $239,031 |
Source: Public Records
Tax History Compared to Growth
Tax History
| Year | Tax Paid | Tax Assessment Tax Assessment Total Assessment is a certain percentage of the fair market value that is determined by local assessors to be the total taxable value of land and additions on the property. | Land | Improvement |
|---|---|---|---|---|
| 2025 | $272 | $503,970 | $160,122 | $343,848 |
| 2024 | $265 | $272,249 | $87,746 | $184,503 |
| 2023 | $257 | $236,500 | $86,097 | $150,403 |
| 2022 | $362 | $267,850 | $74,638 | $193,212 |
| 2021 | $2,704 | $401,000 | $90,328 | $310,672 |
| 2020 | $2,450 | $332,000 | $90,328 | $241,672 |
| 2019 | $2,518 | $323,000 | $43,267 | $279,733 |
| 2018 | $2,594 | $315,306 | $43,267 | $272,039 |
| 2017 | $2,467 | $281,000 | $43,267 | $237,733 |
| 2016 | $2,290 | $139,296 | $23,213 | $116,083 |
| 2015 | $1,985 | $123,730 | $23,213 | $100,517 |
| 2014 | $2,174 | $134,209 | $23,213 | $110,996 |
Source: Public Records
Map
Nearby Homes
- 3443 W 5200 S Unit 2&3
- 4964 S 3375 W
- 3509 W 4835 S Unit 26
- 3523 W 4835 S Unit 28
- 3524 W 4835 S Unit 22
- Poplar Plan at Highgate Cove
- Pando Plan at Highgate Cove
- 3607 W 5400 S
- 5321 S 3100 W
- 3766 W 5300 S
- 3820 Foxglen Dr
- 5432 S 3150 W
- 5578 S 3450 W
- 3671 W 4700 S
- 3627 W 4650 S
- 5538 S 3150 W
- 5009 S 2925 W
- 3632 W 4650 S
- 3046 W 4850 S
- 5235 Midland Dr