Estimated Value: $558,302 - $734,000
2
Beds
2
Baths
1,074
Sq Ft
$601/Sq Ft
Est. Value
About This Home
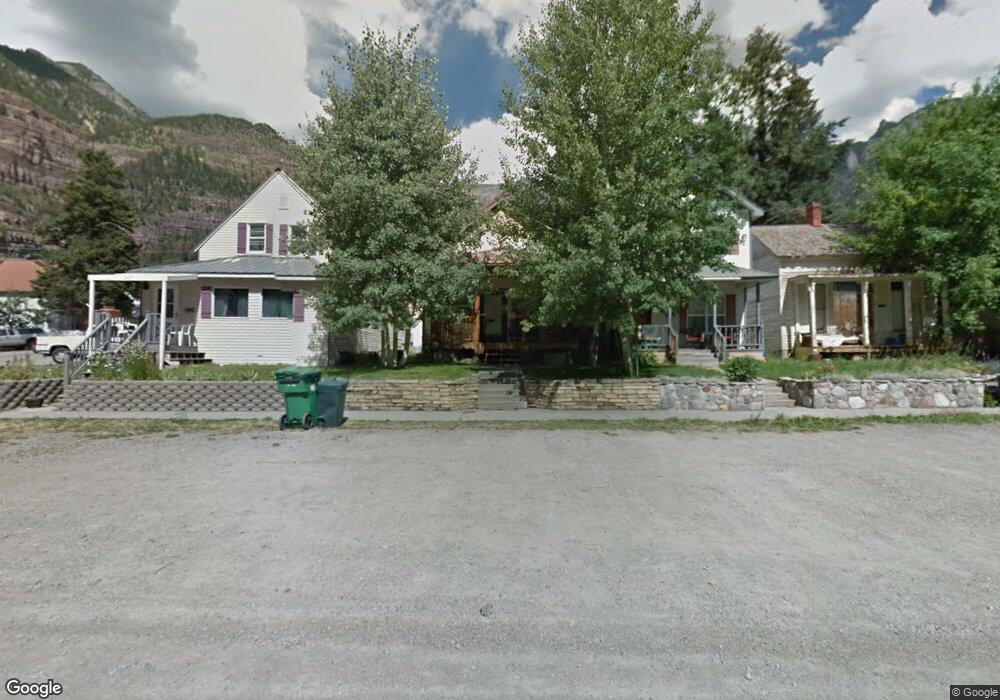
This home is located at 343 2nd St, Ouray, CO 81427 and is currently estimated at $645,076, approximately $600 per square foot. 343 2nd St is a home located in Ouray County with nearby schools including Ouray Elementary School, Ouray Middle School, and Ouray Senior High School.
Ownership History
Date
Name
Owned For
Owner Type
Purchase Details
Closed on
Jan 17, 2020
Sold by
Opdahl Jan T and Opdahl Peter J
Bought by
Falk Kate Elizabeth
Current Estimated Value
Purchase Details
Closed on
Feb 20, 2012
Sold by
Kopell Philip A
Bought by
Opdahl Peter J and Opdahl Jan T
Purchase Details
Closed on
May 21, 2009
Sold by
Liss Robert P and Kopell Philip A
Bought by
Kopell Philip A
Home Financials for this Owner
Home Financials are based on the most recent Mortgage that was taken out on this home.
Original Mortgage
$223,500
Interest Rate
4.76%
Mortgage Type
New Conventional
Create a Home Valuation Report for This Property
The Home Valuation Report is an in-depth analysis detailing your home's value as well as a comparison with similar homes in the area
Home Values in the Area
Average Home Value in this Area
Purchase History
| Date | Buyer | Sale Price | Title Company |
|---|---|---|---|
| Falk Kate Elizabeth | -- | None Available | |
| Opdahl Peter J | $297,000 | Land Title Guarantee Company | |
| Kopell Philip A | -- | Land Title Guarantee Company |
Source: Public Records
Mortgage History
| Date | Status | Borrower | Loan Amount |
|---|---|---|---|
| Previous Owner | Kopell Philip A | $223,500 |
Source: Public Records
Tax History Compared to Growth
Tax History
| Year | Tax Paid | Tax Assessment Tax Assessment Total Assessment is a certain percentage of the fair market value that is determined by local assessors to be the total taxable value of land and additions on the property. | Land | Improvement |
|---|---|---|---|---|
| 2024 | $1,820 | $29,320 | $4,010 | $25,310 |
| 2023 | $1,820 | $32,320 | $4,420 | $27,900 |
| 2022 | $1,307 | $20,930 | $4,410 | $16,520 |
| 2021 | $1,336 | $21,540 | $4,540 | $17,000 |
| 2020 | $1,083 | $17,630 | $4,740 | $12,890 |
| 2019 | $1,083 | $17,630 | $4,740 | $12,890 |
| 2018 | $1,028 | $16,340 | $5,150 | $11,190 |
| 2017 | $1,037 | $16,630 | $0 | $16,630 |
| 2016 | $1,312 | $22,970 | $0 | $22,970 |
| 2015 | -- | $22,970 | $0 | $22,970 |
| 2012 | -- | $19,170 | $0 | $19,170 |
Source: Public Records
Map
Nearby Homes