343 2nd St SE Dickinson, ND 58601
Estimated Value: $214,000 - $504,000
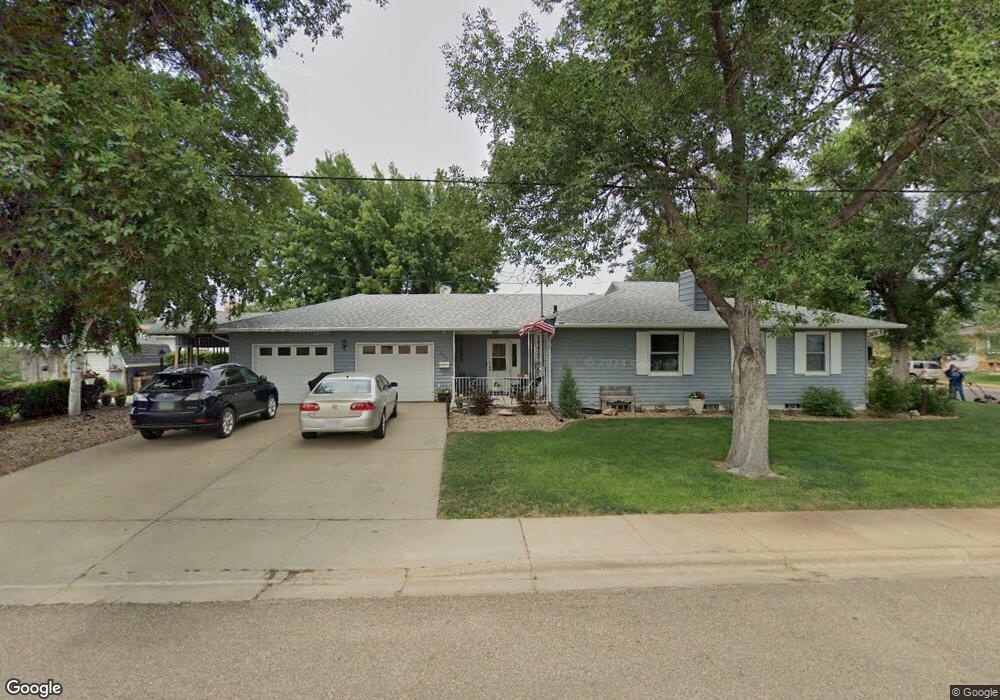
About This Home
This home is located at 343 2nd St SE, Dickinson, ND 58601 and is currently estimated at $338,079, approximately $238 per square foot. 343 2nd St SE is a home located in Stark County with nearby schools including Trinity Elementary School West, St. Joseph School, and Trinity Elementary School East.
Ownership History
We collect this data history from publicly available records. To have your information removed, we recommend requesting removal directly through your county’s website.
Purchase Details
Home Financials for this Owner
Home Financials are based on the most recent Mortgage that was taken out on this home.Home Values in the Area
Average Home Value in this Area
Purchase History
We collect this data history from publicly available records. To have your information removed, we recommend requesting removal directly through your county’s website.
| Date | Buyer | Sale Price | Title Company |
|---|---|---|---|
| -- | None Available |
Mortgage History
We collect this data history from publicly available records. To have your information removed, we recommend requesting removal directly through your county’s website.
| Date | Status | Borrower | Loan Amount |
|---|---|---|---|
| Open | $211,765 |
Tax History
We collect this data history from publicly available records. To have your information removed, we recommend requesting removal directly through your county’s website.
| Year | Tax Paid | Tax Assessment Tax Assessment Total Assessment is a certain percentage of the fair market value that is determined by local assessors to be the total taxable value of land and additions on the property. | Land | Improvement |
|---|---|---|---|---|
| 2025 | $397 | $246,700 | $30,100 | $216,600 |
| 2024 | $1,381 | $246,700 | $30,100 | $216,600 |
| 2023 | $2,426 | $246,700 | $30,100 | $216,600 |
| 2022 | $2,305 | $115,850 | $0 | $0 |
| 2021 | $2,272 | $220,900 | $30,100 | $190,800 |
| 2020 | $2,304 | $220,900 | $30,100 | $190,800 |
| 2019 | $2,310 | $220,900 | $30,100 | $190,800 |
| 2017 | $1,755 | $230,400 | $30,100 | $200,300 |
| 2015 | $1,755 | $200,500 | $28,600 | $171,900 |
| 2014 | $1,825 | $193,000 | $28,600 | $164,400 |
| 2013 | -- | $186,700 | $28,600 | $158,100 |
Map
- 35 4th Ave SE
- 134 E Broadway St
- 207 Kuchenski Dr
- 525 River Dr
- 592 River Dr
- 236 S Main Ave
- 206 Kuchenski Dr
- 243 1st Ave SW
- 292 Kuchenski Dr
- 492 River Dr
- 532 E Broadway St
- 377 1st Ave SW
- 503 5th Ave SE
- 511 Highlands Ave
- 531 3rd Ave SE
- 540 Highlands Ave
- 206 3rd Ave SW
- 304 1st St SW
- 213 2nd Ave E
- 313 W Broadway St
Ask me questions while you tour the home.