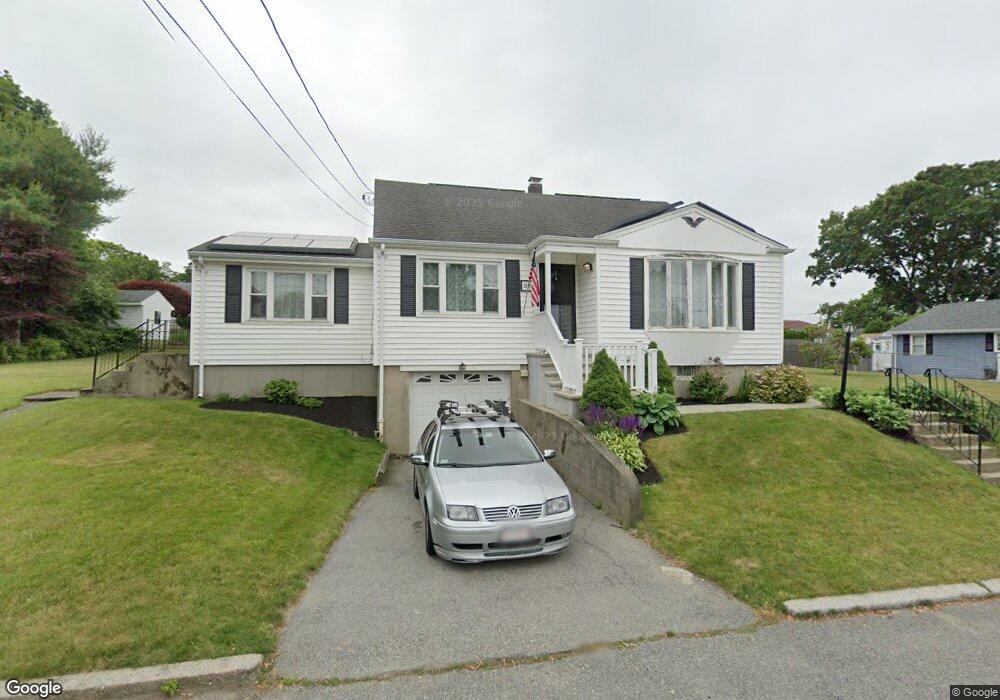
343 Bullock St Unit House Fall River, MA 02720
Bank Street NeighborhoodEstimated Value: $448,000 - $494,000
3
Beds
1
Bath
1,650
Sq Ft
$285/Sq Ft
Est. Value
About This Home
This home is located at 343 Bullock St Unit House, Fall River, MA 02720 and is currently estimated at $469,521, approximately $284 per square foot. 343 Bullock St Unit House is a home located in Bristol County with nearby schools including Mary Fonseca Elementary School, Talbot Innovation School, and B M C Durfee High School.
Ownership History
Date
Name
Owned For
Owner Type
Purchase Details
Closed on
Dec 27, 2013
Sold by
Cabral Joan E and Cabral Ronald F
Bought by
Dias Bruno M and Dias Sabrina P
Current Estimated Value
Purchase Details
Closed on
Jun 2, 2009
Sold by
Cabral Joan E
Bought by
Cabral Joan E and Cabral Ronald F
Create a Home Valuation Report for This Property
The Home Valuation Report is an in-depth analysis detailing your home's value as well as a comparison with similar homes in the area
Home Values in the Area
Average Home Value in this Area
Purchase History
| Date | Buyer | Sale Price | Title Company |
|---|---|---|---|
| Dias Bruno M | -- | -- | |
| Cabral Joan E | -- | -- |
Source: Public Records
Tax History Compared to Growth
Tax History
| Year | Tax Paid | Tax Assessment Tax Assessment Total Assessment is a certain percentage of the fair market value that is determined by local assessors to be the total taxable value of land and additions on the property. | Land | Improvement |
|---|---|---|---|---|
| 2025 | $4,776 | $417,100 | $143,900 | $273,200 |
| 2024 | $4,509 | $392,400 | $138,400 | $254,000 |
| 2023 | $4,534 | $369,500 | $124,200 | $245,300 |
| 2022 | $4,050 | $320,900 | $115,000 | $205,900 |
| 2021 | $4,078 | $294,900 | $108,600 | $186,300 |
| 2020 | $3,823 | $264,600 | $104,600 | $160,000 |
| 2019 | $3,457 | $237,100 | $104,600 | $132,500 |
| 2018 | $3,339 | $228,400 | $104,600 | $123,800 |
| 2017 | $3,125 | $223,200 | $104,600 | $118,600 |
| 2016 | $2,958 | $217,000 | $104,600 | $112,400 |
| 2015 | $2,709 | $207,100 | $97,800 | $109,300 |
| 2014 | $2,662 | $211,600 | $97,800 | $113,800 |
Source: Public Records
Map
Nearby Homes
- 168 Windsor St
- 44 Fenmore St
- 1796 Locust St
- 200 David St
- 235 Chavenson St
- 350 Doherty St
- 302 Oak Grove Ave
- 243 Oak Grove Ave
- 380 Eddy St
- 36 Fordney St
- 344 Beattie St Unit 5
- 14 Downing St
- 108 Garden St
- 23 Lexington St
- 159 Covel St
- 1268 President Ave
- 218 Plain St
- 270 Garden St
- 992 Pine St
- 49 Farnham St