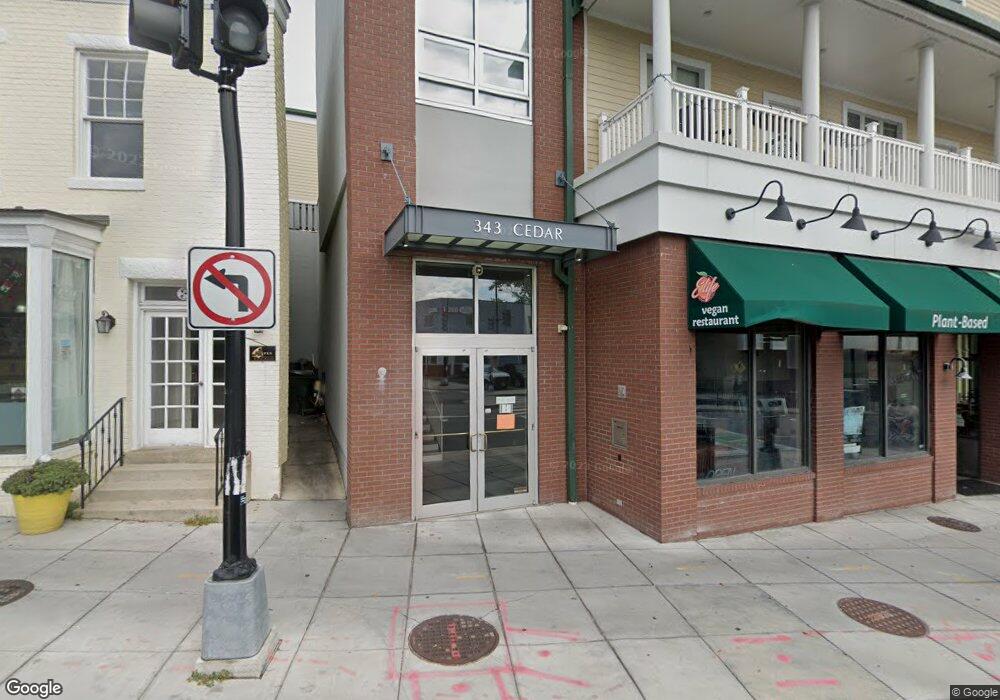
343 Cedar St NW Washington, DC 20012
Takoma NeighborhoodEstimated Value: $471,000 - $515,780
2
Beds
2
Baths
1,161
Sq Ft
$427/Sq Ft
Est. Value
About This Home
This home is located at 343 Cedar St NW, Washington, DC 20012 and is currently estimated at $496,195, approximately $427 per square foot. 343 Cedar St NW is a home located in District of Columbia with nearby schools including Takoma Elementary School, Ida B. Wells Middle School, and Coolidge High School.
Ownership History
Date
Name
Owned For
Owner Type
Purchase Details
Closed on
Apr 17, 2025
Sold by
Pau Lisa
Bought by
May Kendra
Current Estimated Value
Purchase Details
Closed on
Feb 10, 2017
Sold by
Jensen Elissa Michele and Jensen Jeff C
Bought by
Pau Lisa
Home Financials for this Owner
Home Financials are based on the most recent Mortgage that was taken out on this home.
Original Mortgage
$313,500
Interest Rate
4.32%
Mortgage Type
New Conventional
Purchase Details
Closed on
Jun 30, 2008
Sold by
Roles Rebecca
Bought by
Beerbohm Elissa and Jensen Jeff
Home Financials for this Owner
Home Financials are based on the most recent Mortgage that was taken out on this home.
Original Mortgage
$359,100
Interest Rate
6.01%
Mortgage Type
New Conventional
Purchase Details
Closed on
Aug 9, 2005
Sold by
New Legacy I L L C
Bought by
Roles Rebecca J
Home Financials for this Owner
Home Financials are based on the most recent Mortgage that was taken out on this home.
Original Mortgage
$266,240
Interest Rate
5.54%
Mortgage Type
New Conventional
Create a Home Valuation Report for This Property
The Home Valuation Report is an in-depth analysis detailing your home's value as well as a comparison with similar homes in the area
Home Values in the Area
Average Home Value in this Area
Purchase History
| Date | Buyer | Sale Price | Title Company |
|---|---|---|---|
| May Kendra | $498,000 | Westcor Land Title Insurance C | |
| Pau Lisa | $427,500 | Federal Title & Escrow Co | |
| Beerbohm Elissa | $399,000 | -- | |
| Roles Rebecca J | $336,861 | -- |
Source: Public Records
Mortgage History
| Date | Status | Borrower | Loan Amount |
|---|---|---|---|
| Previous Owner | Pau Lisa | $313,500 | |
| Previous Owner | Beerbohm Elissa | $359,100 | |
| Previous Owner | Roles Rebecca J | $266,240 |
Source: Public Records
Tax History
| Year | Tax Paid | Tax Assessment Tax Assessment Total Assessment is a certain percentage of the fair market value that is determined by local assessors to be the total taxable value of land and additions on the property. | Land | Improvement |
|---|---|---|---|---|
| 2025 | $3,145 | $475,470 | $142,640 | $332,830 |
| 2024 | $3,228 | $482,020 | $144,610 | $337,410 |
| 2023 | $3,274 | $483,920 | $145,180 | $338,740 |
| 2022 | $3,123 | $459,900 | $137,970 | $321,930 |
| 2021 | $3,043 | $447,600 | $134,280 | $313,320 |
| 2020 | $3,047 | $434,170 | $130,250 | $303,920 |
| 2019 | $2,801 | $408,900 | $122,670 | $286,230 |
| 2017 | $2,499 | $366,410 | $0 | $0 |
| 2016 | $2,666 | $392,450 | $0 | $0 |
Source: Public Records
Map
Nearby Homes
- 7123 Chestnut St NW
- 422 Butternut St NW Unit T-3
- 7054 Eastern Ave NW Unit 304
- 6722 3rd St NW Unit 204
- 305 Whittier St NW Unit 301
- 6712 6th St NW
- 6932 8th St NW
- 6620 Blair Rd NW
- 6605 3rd St NW
- 6758 Eastern Ave NW
- 123 Walnut St NW
- 213 Van Buren St NW
- 592 Brummel Ct NW Unit 592
- 7125 Georgia Ave NW Unit 9
- 7125 Georgia Ave NW Unit 5
- 7125 Georgia Ave NW Unit 8
- 7125 Georgia Ave NW Unit 4
- 7125 Georgia Ave NW Unit 3
- 7125 Georgia Ave NW Unit 6
- 7129 Georgia Ave NW Unit 4
- 343 Cedar St NW Unit 305
- 343 Cedar St NW Unit 306
- 343 Cedar St NW Unit 108
- 343 Cedar St NW Unit 120
- 343 Cedar St NW Unit 119
- 343 Cedar St NW Unit 107
- 343 Cedar St NW Unit 106
- 343 Cedar St NW Unit 110
- 343 Cedar St NW Unit 312
- 343 Cedar St NW Unit 318
- 343 Cedar St NW Unit 103
- 343 Cedar St NW
- 343 Cedar St NW
- 343 Cedar St NW
- 343 Cedar St NW
- 343 Cedar St NW
- 343 Cedar St NW
- 343 Cedar St NW
- 343 Cedar St NW
- 343 Cedar St NW