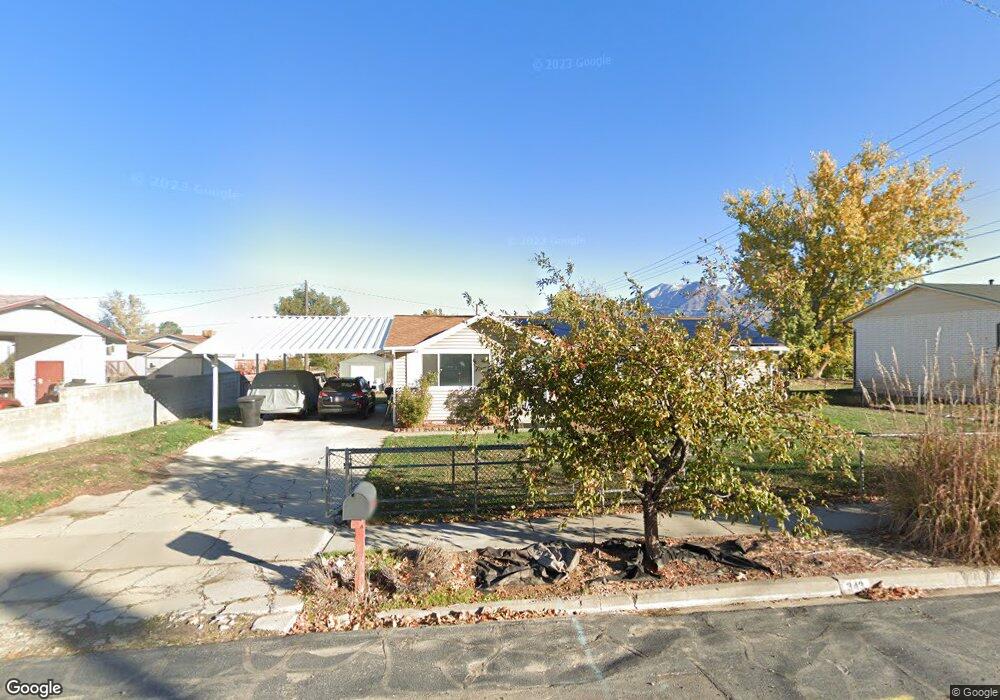
343 E 600 N Spanish Fork, UT 84660
Estimated Value: $440,000 - $461,000
3
Beds
2
Baths
1,330
Sq Ft
$337/Sq Ft
Est. Value
About This Home
This home is located at 343 E 600 N, Spanish Fork, UT 84660 and is currently estimated at $448,207, approximately $336 per square foot. 343 E 600 N is a home with nearby schools including Park Elementary School, Spanish Fork Jr High School, and Spanish Fork High School.
Ownership History
Date
Name
Owned For
Owner Type
Purchase Details
Closed on
Oct 3, 2016
Sold by
Breier Roger John
Bought by
Breier Roger John
Current Estimated Value
Purchase Details
Closed on
Sep 28, 2007
Sold by
Smith Kimberly Marie and Breier Kimberly Marie
Bought by
Breier Roger John
Home Financials for this Owner
Home Financials are based on the most recent Mortgage that was taken out on this home.
Original Mortgage
$135,750
Interest Rate
6.4%
Mortgage Type
New Conventional
Create a Home Valuation Report for This Property
The Home Valuation Report is an in-depth analysis detailing your home's value as well as a comparison with similar homes in the area
Home Values in the Area
Average Home Value in this Area
Purchase History
| Date | Buyer | Sale Price | Title Company |
|---|---|---|---|
| Breier Roger John | -- | None Available | |
| Breier Roger John | -- | 1St National Title Insuranc |
Source: Public Records
Mortgage History
| Date | Status | Borrower | Loan Amount |
|---|---|---|---|
| Closed | Breier Roger John | $135,750 |
Source: Public Records
Tax History
| Year | Tax Paid | Tax Assessment Tax Assessment Total Assessment is a certain percentage of the fair market value that is determined by local assessors to be the total taxable value of land and additions on the property. | Land | Improvement |
|---|---|---|---|---|
| 2025 | $1,991 | $234,520 | -- | -- |
| 2024 | $1,991 | $205,260 | $0 | $0 |
| 2023 | $1,991 | $205,480 | $0 | $0 |
| 2022 | $2,169 | $219,505 | $0 | $0 |
| 2021 | $1,852 | $299,900 | $100,700 | $199,200 |
| 2020 | $1,673 | $263,400 | $83,900 | $179,500 |
| 2019 | $1,449 | $240,000 | $83,900 | $156,100 |
| 2018 | $1,372 | $219,600 | $83,900 | $135,700 |
| 2017 | $1,229 | $105,765 | $0 | $0 |
| 2016 | $1,110 | $94,270 | $0 | $0 |
| 2015 | $1,013 | $84,975 | $0 | $0 |
| 2014 | $935 | $78,705 | $0 | $0 |
Source: Public Records
Map
Nearby Homes
Your Personal Tour Guide
Ask me questions while you tour the home.