
Seller's Agent in 2015
Christopher Terry
E Z Home Search Real Estate Inc.
(774) 930-4595
7 in this area
70 Total Sales

Estimated Value: $456,638 - $503,000
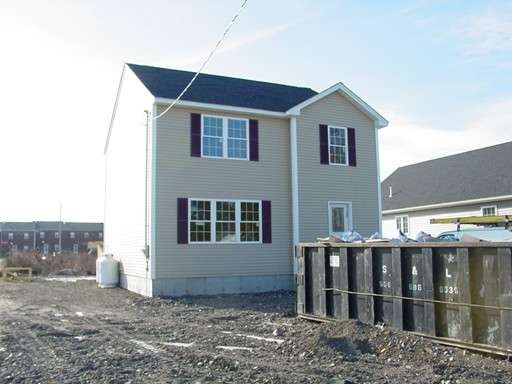
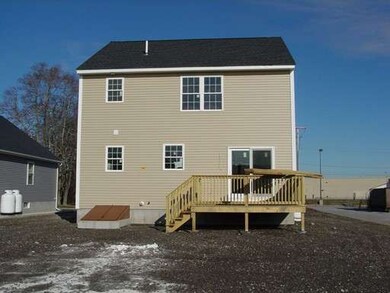
Quality home by quality local builder. Features 3 bedrooms, 2 baths, hardwood and tile floors, central air, large deck. Dead End Street, South End location.
Last Agent to Sell the Property
E Z Home Search Real Estate Inc. Listed on: 01/24/2015
Home Type
Single Family
Year Built
2015
Lot Details
6,970 Sq Ft Lot
| Date | Event | Price | List to Sale | Price per Sq Ft |
|---|---|---|---|---|
| 02/19/2015 02/19/15 | Sold | $215,000 | -2.2% | $128 / Sq Ft |
| 01/24/2015 01/24/15 | Pending | -- | -- | -- |
| 01/24/2015 01/24/15 | For Sale | $219,900 | -- | $131 / Sq Ft |
| Year | Tax Paid | Tax Assessment Tax Assessment Total Assessment is a certain percentage of the fair market value that is determined by local assessors to be the total taxable value of land and additions on the property. | Land | Improvement |
|---|---|---|---|---|
| 2025 | $4,440 | $387,800 | $95,600 | $292,200 |
| 2024 | $4,148 | $361,000 | $92,000 | $269,000 |
| 2023 | $4,146 | $337,900 | $78,900 | $259,000 |
| 2022 | $3,469 | $286,100 | $71,700 | $214,400 |
| 2021 | $3,469 | $250,800 | $66,300 | $184,500 |
| 2020 | $3,410 | $236,000 | $63,500 | $172,500 |
| 2019 | $3,295 | $226,000 | $60,500 | $165,500 |
| 2018 | $3,130 | $214,100 | $59,300 | $154,800 |
| 2017 | $2,975 | $212,500 | $60,500 | $152,000 |
| 2016 | $2,806 | $205,900 | $63,100 | $142,800 |
| 2015 | $2,441 | $186,600 | $81,000 | $105,600 |
| 2014 | $1,072 | $85,200 | $85,200 | $0 |
Seller's Agent in 2015
Christopher Terry
E Z Home Search Real Estate Inc.
(774) 930-4595
7 in this area
70 Total Sales
Source: MLS Property Information Network (MLS PIN)
MLS Number: 71787271
APN: FALL-000006C-000000-000043
Disclaimer: Certain information contained herein is derived from information provided by parties other than Homes.com. All information provided is deemed reliable, but is not guaranteed to be accurate and should be independently verified.
![]() The property listing data and information, or the Images, set forth herein were provided to MLS Property Information Network, Inc. from third party sources, including sellers, lessors and public records, and were compiled by MLS Property Information Network, Inc. The property listing data and information, and the Images, are for the personal, non-commercial use of consumers having a good faith interest in purchasing or leasing listed properties of the type displayed to them and may not be used for any purpose other than to identify prospective properties which such consumers may have a good faith interest in purchasing or leasing. MLS Property Information Network, Inc. and its subscribers disclaim any and all representations and warranties as to the accuracy of the property listing data and information, or as to the accuracy of any of the Images, set forth herein.
The property listing data and information, or the Images, set forth herein were provided to MLS Property Information Network, Inc. from third party sources, including sellers, lessors and public records, and were compiled by MLS Property Information Network, Inc. The property listing data and information, and the Images, are for the personal, non-commercial use of consumers having a good faith interest in purchasing or leasing listed properties of the type displayed to them and may not be used for any purpose other than to identify prospective properties which such consumers may have a good faith interest in purchasing or leasing. MLS Property Information Network, Inc. and its subscribers disclaim any and all representations and warranties as to the accuracy of the property listing data and information, or as to the accuracy of any of the Images, set forth herein.
Ask me questions while you tour the home.