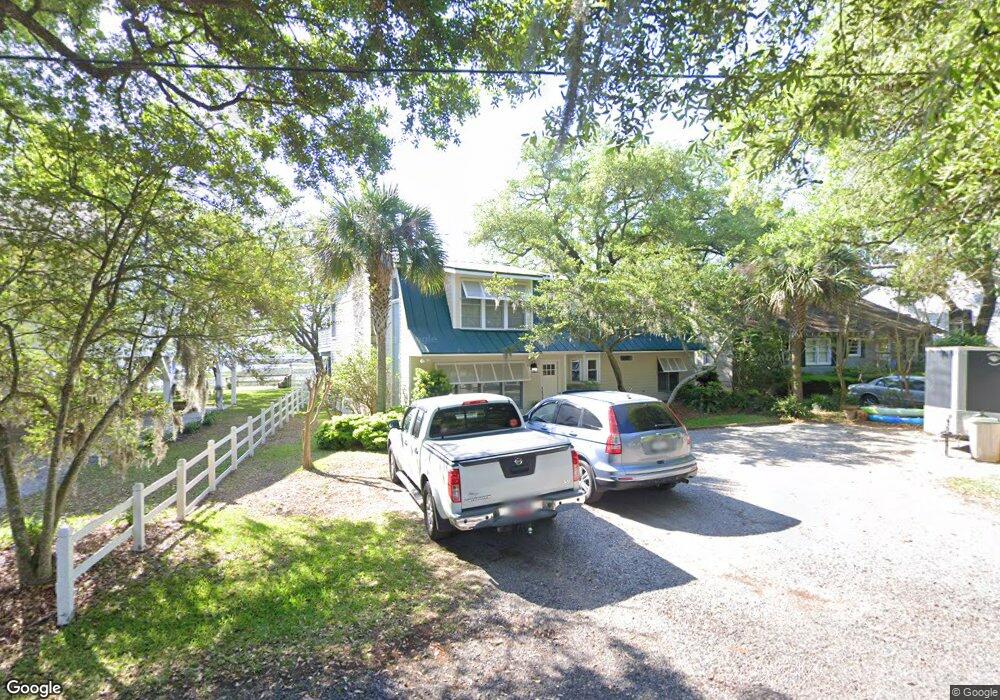
343 Hermitage Ln Murrells Inlet, SC 29576
Estimated Value: $750,000 - $1,149,000
3
Beds
2
Baths
2,644
Sq Ft
$342/Sq Ft
Est. Value
About This Home
This home is located at 343 Hermitage Ln, Murrells Inlet, SC 29576 and is currently estimated at $903,683, approximately $341 per square foot. 343 Hermitage Ln is a home located in Georgetown County with nearby schools including Waccamaw Elementary School, Waccamaw Intermediate School, and Waccamaw Middle School.
Ownership History
Date
Name
Owned For
Owner Type
Purchase Details
Closed on
Jul 17, 2020
Sold by
Welch Barbara R and Richardson Betsy R
Bought by
Welch Robert E and Welch Barbara R
Current Estimated Value
Home Financials for this Owner
Home Financials are based on the most recent Mortgage that was taken out on this home.
Original Mortgage
$210,000
Outstanding Balance
$187,576
Interest Rate
3.5%
Mortgage Type
New Conventional
Estimated Equity
$716,107
Purchase Details
Closed on
Sep 19, 2014
Sold by
Rwr Llc
Bought by
Welch Barbara R and Richardson Betsy R
Purchase Details
Closed on
May 6, 2009
Sold by
Rodgers Samuel A and Welch Barbara R
Bought by
Rwr Llc
Purchase Details
Closed on
May 7, 2004
Sold by
Layman Robin Wellons and Layman Robin Hyatt
Bought by
Rodgers Samuel A
Purchase Details
Closed on
Dec 18, 2001
Sold by
Wellons William S and Wellons Charles R
Bought by
Wellons Wesley Cooper and Wesley Cooper Wellons Trust
Create a Home Valuation Report for This Property
The Home Valuation Report is an in-depth analysis detailing your home's value as well as a comparison with similar homes in the area
Home Values in the Area
Average Home Value in this Area
Purchase History
| Date | Buyer | Sale Price | Title Company |
|---|---|---|---|
| Welch Robert E | $205,166 | None Available | |
| Welch Barbara R | -- | -- | |
| Rwr Llc | -- | -- | |
| Rodgers Samuel A | $575,000 | -- | |
| Wellons Wesley Cooper | -- | -- |
Source: Public Records
Mortgage History
| Date | Status | Borrower | Loan Amount |
|---|---|---|---|
| Open | Welch Robert E | $210,000 |
Source: Public Records
Tax History Compared to Growth
Tax History
| Year | Tax Paid | Tax Assessment Tax Assessment Total Assessment is a certain percentage of the fair market value that is determined by local assessors to be the total taxable value of land and additions on the property. | Land | Improvement |
|---|---|---|---|---|
| 2024 | $3,427 | $24,120 | $16,000 | $8,120 |
| 2023 | $3,427 | $24,120 | $16,000 | $8,120 |
| 2022 | $2,860 | $24,120 | $16,000 | $8,120 |
| 2021 | $2,769 | $24,120 | $16,000 | $8,120 |
| 2020 | $2,761 | $24,120 | $16,000 | $8,120 |
| 2019 | $2,794 | $0 | $0 | $0 |
| 2018 | $2,864 | $0 | $0 | $0 |
| 2017 | $2,575 | $0 | $0 | $0 |
| 2016 | $2,548 | $24,572 | $0 | $0 |
| 2015 | $6,736 | $0 | $0 | $0 |
| 2014 | $6,736 | $553,600 | $408,500 | $145,100 |
| 2012 | -- | $553,600 | $408,500 | $145,100 |
Source: Public Records
Map
Nearby Homes
- 3866 Highway 17 Business Unit c-9
- 3866 Highway 17 Business Unit C-3
- 3969 Murrells Inlet Rd
- 618 Otter Ave
- 590 Hammock Ave
- 3887 Spanner Way Unit Behind The Marshwalk
- 15 Flaggpoint Ln
- 567 Sunnyside Ave
- 3800 Murrells Inlet Rd
- 81 Delray Dr Unit 3-B
- 81 Delray Dr Unit 2-C
- TBD Highway 17 Business
- 624 Blackberry Ave
- 6 Cottage Dr
- 4240 Highway 17 Business
- 108 Hallandale Ln Unit Right
- 108 Hallandale Ln Unit Lot 9-B
- 110 Hallandale Ln Unit Lot 9- A
- 110 Hallandale Ln Unit Left
- 148 Hallandale Ln Unit Left
- 335 Hermitage Ln
- 3951 Highway 17 Business
- 331 Hermitage Ln
- 3957 Highway 17 Business Unit waterfront Historic
- 3957 Highway 17 Business
- 3909 Rice Planters Way Unit The Hermitage
- 3909 Rice Planters Way
- 3909 Rice Planters Way Unit Lot 13
- 327 Hermitage Ln
- 3910 Rice Planters Way
- 3907 Rice Planters Way
- 3965 Highway 17 Business
- 3905 Rice Planters Way
- 387 Oak Moss Ct
- 387 Oak Moss Ct Unit The Hermitage
- 385 Oak Moss Ct
- 383 Oak Moss Ct Unit The Hermitage
- 383 Oak Moss Ct
- 2063 Marsh Walk
- 2017 Marsh Walk