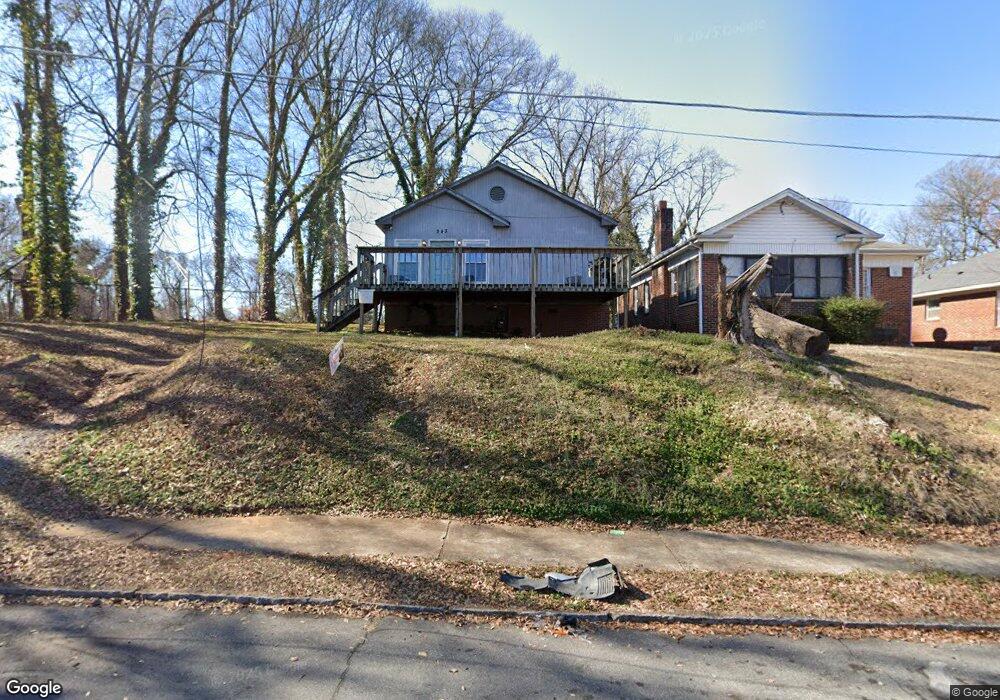
343 Holderness St SW Atlanta, GA 30310
West End NeighborhoodEstimated Value: $250,747 - $278,000
3
Beds
2
Baths
1,204
Sq Ft
$218/Sq Ft
Est. Value
About This Home
This home is located at 343 Holderness St SW, Atlanta, GA 30310 and is currently estimated at $262,187, approximately $217 per square foot. 343 Holderness St SW is a home located in Fulton County with nearby schools including M. A. Jones Elementary School, Herman J. Russell West End Academy, and Booker T. Washington High School.
Ownership History
Date
Name
Owned For
Owner Type
Purchase Details
Closed on
Sep 8, 2015
Sold by
Lyda Heather
Bought by
Patel Mahendrahhai and Patel Lina
Current Estimated Value
Purchase Details
Closed on
Oct 18, 2011
Sold by
Jim Roze Corp
Bought by
Lyda Heather
Purchase Details
Closed on
Jul 1, 2007
Sold by
Trivision Financial Llc
Bought by
Jimroze Corp
Purchase Details
Closed on
Dec 22, 2006
Sold by
Bampole-Perry Willene
Bought by
Trivision Financial Llc
Home Financials for this Owner
Home Financials are based on the most recent Mortgage that was taken out on this home.
Original Mortgage
$155,000
Interest Rate
6.1%
Mortgage Type
Trade
Purchase Details
Closed on
Apr 10, 2001
Sold by
Simpson Gary
Bought by
Bampoe and Bampoe Parry Willene
Create a Home Valuation Report for This Property
The Home Valuation Report is an in-depth analysis detailing your home's value as well as a comparison with similar homes in the area
Home Values in the Area
Average Home Value in this Area
Purchase History
| Date | Buyer | Sale Price | Title Company |
|---|---|---|---|
| Patel Mahendrahhai | $33,825 | -- | |
| Lyda Heather | $14,900 | -- | |
| Jimroze Corp | -- | -- | |
| Trivision Financial Llc | $62,500 | -- | |
| Bampoe | $20,000 | -- |
Source: Public Records
Mortgage History
| Date | Status | Borrower | Loan Amount |
|---|---|---|---|
| Previous Owner | Trivision Financial Llc | $155,000 |
Source: Public Records
Tax History Compared to Growth
Tax History
| Year | Tax Paid | Tax Assessment Tax Assessment Total Assessment is a certain percentage of the fair market value that is determined by local assessors to be the total taxable value of land and additions on the property. | Land | Improvement |
|---|---|---|---|---|
| 2025 | $582 | $93,000 | $50,640 | $42,360 |
| 2023 | $3,850 | $93,000 | $50,640 | $42,360 |
| 2022 | $3,024 | $74,720 | $34,080 | $40,640 |
| 2021 | $2,476 | $61,120 | $26,920 | $34,200 |
| 2020 | $2,337 | $57,040 | $27,160 | $29,880 |
| 2019 | $484 | $47,080 | $12,640 | $34,440 |
| 2018 | $623 | $15,040 | $4,760 | $10,280 |
| 2017 | $584 | $13,520 | $3,720 | $9,800 |
| 2016 | $585 | $13,520 | $3,720 | $9,800 |
| 2015 | $498 | $11,480 | $3,160 | $8,320 |
| 2014 | $481 | $10,600 | $4,880 | $5,720 |
Source: Public Records
Map
Nearby Homes
- 1181 Westview Dr SW
- 253 1st St SW
- 228 Napoleon Dr SW
- 375 Atwood St SW
- 225 1st St SW
- 1150 Fair St SW
- 1152 Greenwich St SW
- 1159 Fair St SW
- 253 Lawton St SW
- 450 Atwood St SW
- 1247 Lucile Ave SW
- 945 Fair St SW
- 0 Lucile Ave Unit 7665312
- 442 Hopkins St SW
- 0 Lucile Ave SW Unit 10624252
- 494 Atwood St SW
- 210 Chicamauga Ave SW
- 136 Stafford St SW
- 167 Rockmart Dr SW
- 159 Lawton St SW
- 339 Holderness St SW
- 333 Holderness St SW
- 329 Holderness St SW
- 325 Holderness St SW
- 342 Holderness St SW
- 346 Holderness St SW
- 319 Holderness St SW Unit 319
- 319 Holderness St SW
- 319 Holderness St SW
- 356 Holderness St SW
- 1182 Sells Ave SW
- 338 Holderness St SW
- 315 Holderness St SW
- 326 Holderness St SW
- 334 Holderness St SW Unit Apartment A
- 334 Holderness St SW Unit 2
- 334 Holderness St SW
- 316 Atwood St SW
- 316 Atwood St SW Unit B
- 316 Atwood St SW Unit A