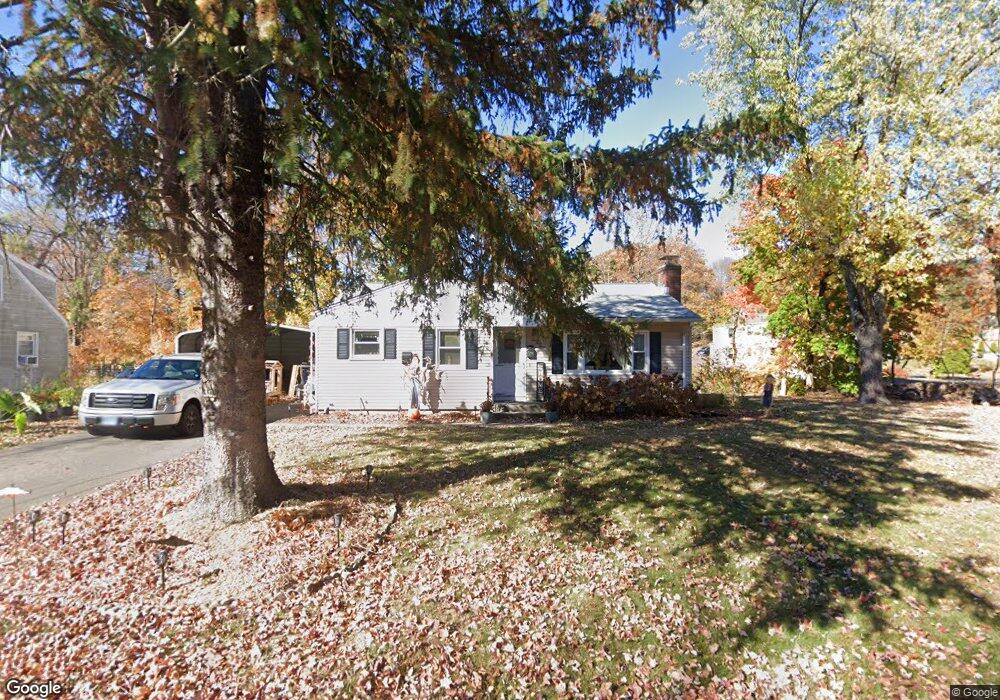
343 Lewis Rd New Britain, CT 06053
Estimated Value: $282,000 - $318,252
3
Beds
1
Bath
1,098
Sq Ft
$276/Sq Ft
Est. Value
About This Home
This home is located at 343 Lewis Rd, New Britain, CT 06053 and is currently estimated at $303,063, approximately $276 per square foot. 343 Lewis Rd is a home located in Hartford County with nearby schools including Holmes School, Pulaski Middle School, and St. Francis of Assisi Middle School.
Ownership History
Date
Name
Owned For
Owner Type
Purchase Details
Closed on
Dec 4, 2012
Sold by
Smith Kevin and Perez Alicia
Bought by
Smith Kevin and Smith Alicia
Current Estimated Value
Home Financials for this Owner
Home Financials are based on the most recent Mortgage that was taken out on this home.
Original Mortgage
$175,117
Outstanding Balance
$100,491
Interest Rate
3.62%
Mortgage Type
FHA
Estimated Equity
$202,572
Purchase Details
Closed on
Mar 6, 2006
Sold by
Lareau Roland
Bought by
Smith Kevin and Perez Alicia
Home Financials for this Owner
Home Financials are based on the most recent Mortgage that was taken out on this home.
Original Mortgage
$142,400
Interest Rate
8.2%
Purchase Details
Closed on
Jul 1, 2002
Sold by
Gray Robert E
Bought by
Lareau Roland
Purchase Details
Closed on
Dec 4, 1987
Sold by
Szczepankowski D
Bought by
Lubin Randy Keith
Create a Home Valuation Report for This Property
The Home Valuation Report is an in-depth analysis detailing your home's value as well as a comparison with similar homes in the area
Home Values in the Area
Average Home Value in this Area
Purchase History
| Date | Buyer | Sale Price | Title Company |
|---|---|---|---|
| Smith Kevin | -- | -- | |
| Smith Kevin | $178,000 | -- | |
| Lareau Roland | $110,000 | -- | |
| Lubin Randy Keith | $132,000 | -- |
Source: Public Records
Mortgage History
| Date | Status | Borrower | Loan Amount |
|---|---|---|---|
| Open | Lubin Randy Keith | $175,117 | |
| Previous Owner | Lubin Randy Keith | $182,700 | |
| Previous Owner | Lubin Randy Keith | $142,400 |
Source: Public Records
Tax History Compared to Growth
Tax History
| Year | Tax Paid | Tax Assessment Tax Assessment Total Assessment is a certain percentage of the fair market value that is determined by local assessors to be the total taxable value of land and additions on the property. | Land | Improvement |
|---|---|---|---|---|
| 2025 | $6,012 | $153,440 | $75,950 | $77,490 |
| 2024 | $6,075 | $153,440 | $75,950 | $77,490 |
| 2023 | $5,874 | $153,440 | $75,950 | $77,490 |
| 2022 | $4,924 | $99,470 | $35,000 | $64,470 |
| 2021 | $4,924 | $99,470 | $35,000 | $64,470 |
| 2020 | $5,023 | $99,470 | $35,000 | $64,470 |
| 2019 | $5,023 | $99,470 | $35,000 | $64,470 |
| 2018 | $5,023 | $99,470 | $35,000 | $64,470 |
| 2017 | $4,723 | $93,520 | $31,920 | $61,600 |
| 2016 | $4,723 | $93,520 | $31,920 | $61,600 |
| 2015 | $4,582 | $93,520 | $31,920 | $61,600 |
| 2014 | $4,582 | $93,520 | $31,920 | $61,600 |
Source: Public Records
Map
Nearby Homes
- 57 Merigold Dr
- 187 Miriam Rd
- 90 Country Club Rd
- 55 Alexander Rd
- 910 Farmington Ave
- 40 Varmor Dr
- 34 Hutchinson St
- 83 Kim Dr
- 164 Brittany Farms Rd Unit A
- 192 Blodgett Roy Dr
- 198 Brittany Farms Rd Unit D
- 84 Barbour Rd
- 180 Batterson Park Rd
- 182 Batterson Park Rd
- 29 Bradford Walk Unit 29
- 258 Eddy Glover Blvd
- 67 Eastwick Rd
- 394 Mcclintock St
- 135 Village Square Dr Unit 1
- 59 Heather Ln