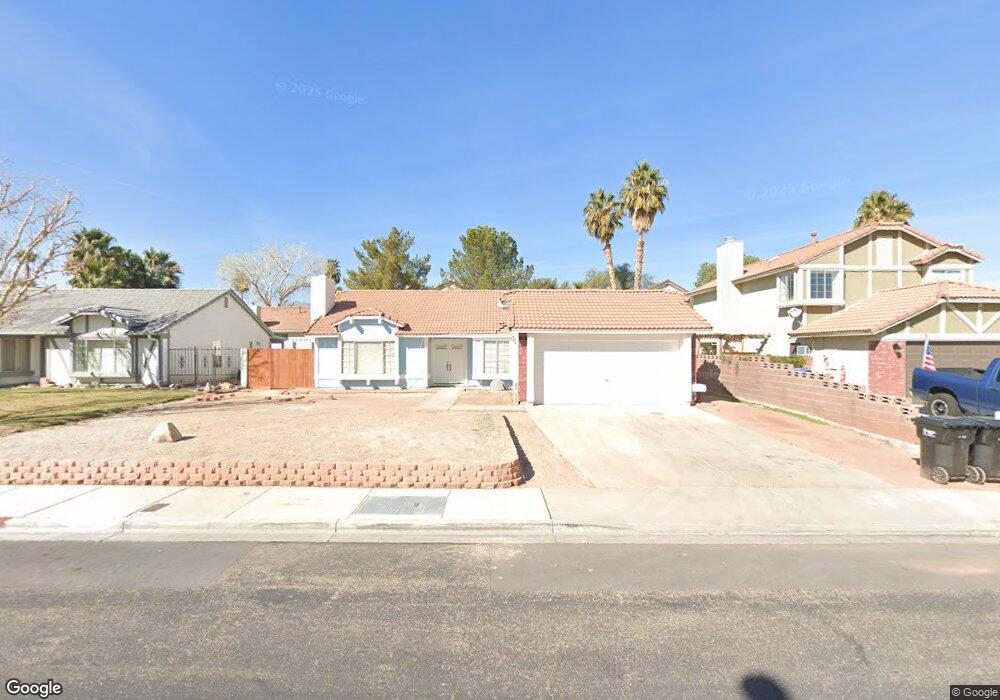
343 Moreno Ct Henderson, NV 89014
Green Valley North NeighborhoodEstimated Value: $447,000 - $471,000
3
Beds
2
Baths
1,729
Sq Ft
$264/Sq Ft
Est. Value
About This Home
This home is located at 343 Moreno Ct, Henderson, NV 89014 and is currently estimated at $457,181, approximately $264 per square foot. 343 Moreno Ct is a home located in Clark County with nearby schools including James Gibson Elementary School, Barbara and Hank Greenspun Junior High School, and Green Valley High School.
Ownership History
Date
Name
Owned For
Owner Type
Purchase Details
Closed on
Jul 5, 2018
Sold by
Newcomer Kenneth and Revoc Newcomer Revoc
Bought by
Newcomer Kenneth
Current Estimated Value
Purchase Details
Closed on
Dec 10, 1998
Sold by
Newcomer Reva M and Newcomer Kenneth E
Bought by
Newcomer Kenneth and Newcomer Reva
Purchase Details
Closed on
Jun 23, 1998
Sold by
Burns Frank W and Burns Evelyn K
Bought by
Newcomer Kenneth E and Newcomer Reva M
Home Financials for this Owner
Home Financials are based on the most recent Mortgage that was taken out on this home.
Original Mortgage
$132,300
Interest Rate
7.01%
Purchase Details
Closed on
Nov 25, 1997
Sold by
Burns Frank W and Cerrone Burns Evelyn K
Bought by
Burns Frank W and Burns Evelyn K
Home Financials for this Owner
Home Financials are based on the most recent Mortgage that was taken out on this home.
Original Mortgage
$29,540
Interest Rate
7.33%
Create a Home Valuation Report for This Property
The Home Valuation Report is an in-depth analysis detailing your home's value as well as a comparison with similar homes in the area
Home Values in the Area
Average Home Value in this Area
Purchase History
| Date | Buyer | Sale Price | Title Company |
|---|---|---|---|
| Newcomer Kenneth | $300,000 | None Available | |
| Newcomer Kenneth | -- | -- | |
| Newcomer Kenneth E | $145,000 | Fidelity National Title | |
| Burns Frank W | -- | United Title |
Source: Public Records
Mortgage History
| Date | Status | Borrower | Loan Amount |
|---|---|---|---|
| Previous Owner | Newcomer Kenneth E | $132,300 | |
| Previous Owner | Burns Frank W | $29,540 |
Source: Public Records
Tax History Compared to Growth
Tax History
| Year | Tax Paid | Tax Assessment Tax Assessment Total Assessment is a certain percentage of the fair market value that is determined by local assessors to be the total taxable value of land and additions on the property. | Land | Improvement |
|---|---|---|---|---|
| 2025 | $1,734 | $87,043 | $38,500 | $48,543 |
| 2024 | $1,684 | $87,043 | $38,500 | $48,543 |
| 2023 | $1,684 | $86,369 | $39,200 | $47,169 |
| 2022 | $1,635 | $74,528 | $30,800 | $43,728 |
| 2021 | $1,588 | $71,816 | $29,750 | $42,066 |
| 2020 | $1,539 | $70,872 | $28,700 | $42,172 |
| 2019 | $1,494 | $66,179 | $24,150 | $42,029 |
| 2018 | $1,450 | $61,973 | $21,000 | $40,973 |
| 2017 | $1,825 | $62,969 | $21,000 | $41,969 |
| 2016 | $1,374 | $59,236 | $16,450 | $42,786 |
| 2015 | $1,371 | $53,091 | $12,600 | $40,491 |
| 2014 | $1,331 | $44,563 | $8,750 | $35,813 |
Source: Public Records
Map
Nearby Homes
- 1926 Navarre Ln
- 372 Rushing Creek Ct
- 347 Gana Ct Unit B
- 316 Santa Monica Dr
- 1939 Guinn Dr
- 2108 Running River Rd
- 272 Grand Teton Dr
- 1832 Muchacha Dr
- 322 Oliveiro Ct
- 346 Pinnacle Ct
- 259 Spring Hills Ln
- 374 Santali Ct
- 2050 W Warm Springs Rd Unit 312
- 2050 W Warm Springs Rd Unit 4521
- 2050 W Warm Springs Rd Unit 1311
- 2050 W Warm Springs Rd Unit 3624
- 2050 W Warm Springs Rd Unit 224
- 2050 W Warm Springs Rd Unit 411
- 409 Indigo Springs St
- 327 Fuente Dr
- 341 Moreno Ct
- 345 Moreno Ct
- 346 Santa Monica Dr
- 348 Santa Monica Dr
- 344 Santa Monica Dr
- 339 Moreno Ct
- 342 Moreno Ct
- 344 Moreno Ct
- 340 Moreno Ct
- 342 Santa Monica Dr
- 350 Rushing Creek Ct
- 338 Moreno Ct
- 355 Rushing Creek Ct
- 340 Santa Monica Dr
- 337 Moreno Ct
- 339 Simon Bolivar Dr
- 347 Santa Monica Dr
- 352 Rushing Creek Ct
- 341 Simon Bolivar Dr
- 337 Simon Bolivar Dr