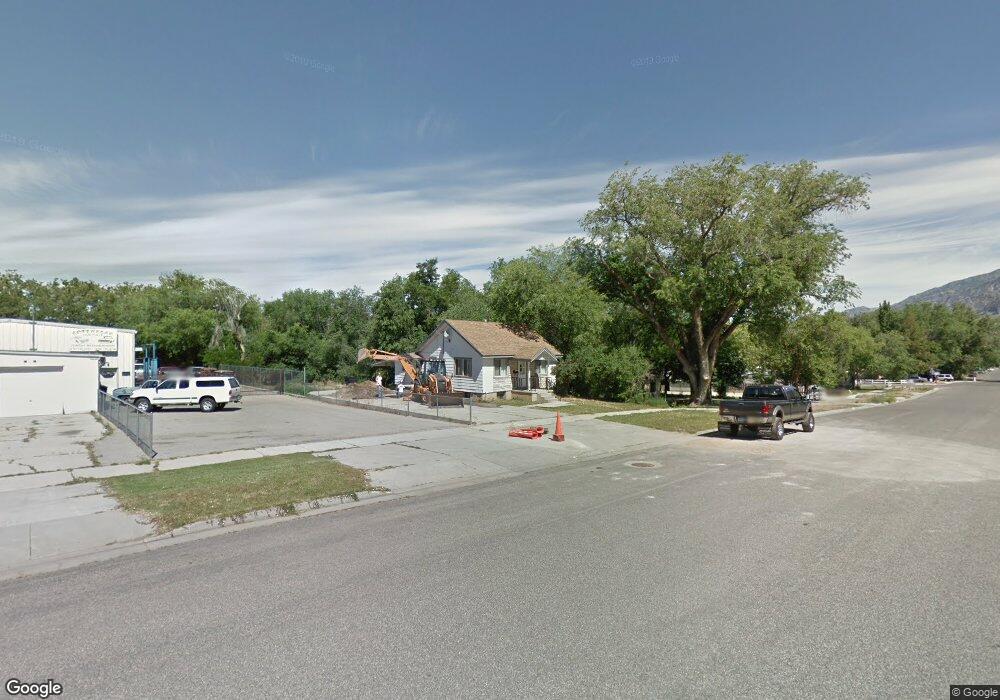
343 N 100 E Brigham City, UT 84302
Estimated Value: $325,000 - $365,000
4
Beds
2
Baths
1,800
Sq Ft
$195/Sq Ft
Est. Value
About This Home
This home is located at 343 N 100 E, Brigham City, UT 84302 and is currently estimated at $350,646, approximately $194 per square foot. 343 N 100 E is a home located in Box Elder County with nearby schools including Golden Spike Elementary, Box Elder Middle School, and Adele C. Young Intermediate School.
Ownership History
Date
Name
Owned For
Owner Type
Purchase Details
Closed on
Feb 15, 2022
Sold by
Thomas Lee Sindi
Bought by
Steeneck Brayden William
Current Estimated Value
Home Financials for this Owner
Home Financials are based on the most recent Mortgage that was taken out on this home.
Original Mortgage
$304,000
Outstanding Balance
$280,640
Interest Rate
3.69%
Mortgage Type
New Conventional
Estimated Equity
$70,006
Purchase Details
Closed on
Aug 14, 2019
Sold by
Mcpherson Shealyn
Bought by
Lee Sindi Thomas
Purchase Details
Closed on
Feb 13, 2018
Sold by
Gudmundson Judy A
Bought by
Mcpherson Shealyn
Purchase Details
Closed on
Sep 8, 2015
Sold by
Dommasch Jordan N
Bought by
Gudmundson Judy A
Home Financials for this Owner
Home Financials are based on the most recent Mortgage that was taken out on this home.
Original Mortgage
$81,225
Interest Rate
3.91%
Mortgage Type
New Conventional
Purchase Details
Closed on
May 22, 2007
Sold by
Goodsell Kenneth L
Bought by
Dommasch Jordan N
Purchase Details
Closed on
Aug 11, 2006
Sold by
Goodsell Kenneth L
Bought by
Goodsell Kenneth L
Create a Home Valuation Report for This Property
The Home Valuation Report is an in-depth analysis detailing your home's value as well as a comparison with similar homes in the area
Purchase History
| Date | Buyer | Sale Price | Title Company |
|---|---|---|---|
| Steeneck Brayden William | -- | Cottonwood Title | |
| Lee Sindi Thomas | -- | Advanced Title | |
| Mcpherson Shealyn | -- | Advanced Title | |
| Gudmundson Judy A | -- | Phillips Hansen Land Title C | |
| Dommasch Jordan N | -- | First Aemrican Title Ins Age | |
| Goodsell Kenneth L | -- | Mt View Title & Escrow Inc |
Source: Public Records
Mortgage History
| Date | Status | Borrower | Loan Amount |
|---|---|---|---|
| Open | Steeneck Brayden William | $304,000 | |
| Previous Owner | Gudmundson Judy A | $81,225 |
Source: Public Records
Tax History
| Year | Tax Paid | Tax Assessment Tax Assessment Total Assessment is a certain percentage of the fair market value that is determined by local assessors to be the total taxable value of land and additions on the property. | Land | Improvement |
|---|---|---|---|---|
| 2025 | -- | $303,464 | $105,000 | $198,464 |
| 2024 | -- | $296,840 | $100,000 | $196,840 |
| 2023 | $1,533 | $302,122 | $95,000 | $207,122 |
| 2022 | $1,260 | $126,955 | $22,000 | $104,955 |
| 2021 | $1,102 | $158,786 | $40,000 | $118,786 |
| 2020 | $977 | $158,786 | $40,000 | $118,786 |
| 2019 | $923 | $79,816 | $22,000 | $57,816 |
| 2018 | $841 | $72,275 | $22,000 | $50,275 |
| 2017 | $770 | $114,627 | $16,500 | $84,627 |
| 2016 | $808 | $60,828 | $16,500 | $44,328 |
| 2015 | $757 | $56,799 | $16,500 | $40,299 |
| 2014 | $757 | $54,880 | $16,500 | $38,380 |
| 2013 | -- | $54,880 | $16,500 | $38,380 |
Source: Public Records
Map
Nearby Homes
Your Personal Tour Guide
Ask me questions while you tour the home.