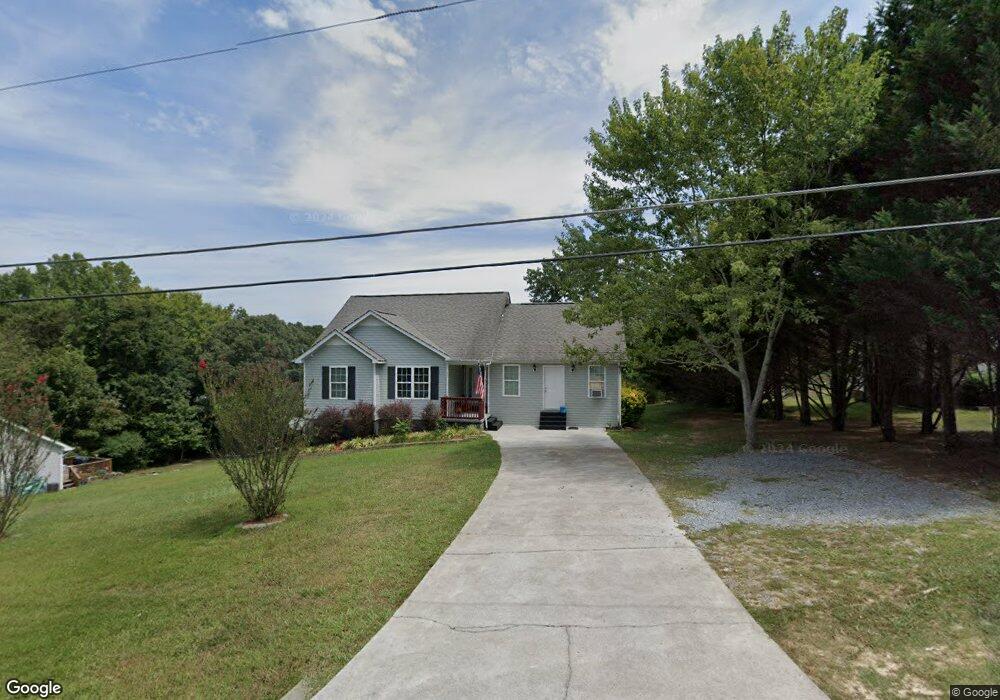
343 Pathfinder Cir SE Calhoun, GA 30701
Estimated Value: $238,000 - $249,000
3
Beds
2
Baths
1,138
Sq Ft
$214/Sq Ft
Est. Value
About This Home
This home is located at 343 Pathfinder Cir SE, Calhoun, GA 30701 and is currently estimated at $243,348, approximately $213 per square foot. 343 Pathfinder Cir SE is a home located in Gordon County with nearby schools including Sonoraville Elementary School, Red Bud Middle School, and Sonoraville High School.
Ownership History
Date
Name
Owned For
Owner Type
Purchase Details
Closed on
Mar 31, 2010
Sold by
Secretary Of Housing And Urban Developme
Bought by
Smith Vernon C
Current Estimated Value
Home Financials for this Owner
Home Financials are based on the most recent Mortgage that was taken out on this home.
Original Mortgage
$72,346
Outstanding Balance
$48,113
Interest Rate
4.97%
Mortgage Type
New Conventional
Estimated Equity
$195,235
Purchase Details
Closed on
Aug 4, 2009
Sold by
Pass Danyl and Pass Miranda
Bought by
Wells Fargo Bank Na
Purchase Details
Closed on
Jan 7, 2005
Sold by
Builders Inc
Bought by
Danyl Pass and Pass Miranda
Home Financials for this Owner
Home Financials are based on the most recent Mortgage that was taken out on this home.
Original Mortgage
$104,077
Interest Rate
5.61%
Mortgage Type
FHA
Create a Home Valuation Report for This Property
The Home Valuation Report is an in-depth analysis detailing your home's value as well as a comparison with similar homes in the area
Home Values in the Area
Average Home Value in this Area
Purchase History
| Date | Buyer | Sale Price | Title Company |
|---|---|---|---|
| Smith Vernon C | $69,500 | -- | |
| Wells Fargo Bank Na | $113,400 | -- | |
| Secretary Of Housing & Urban Development | $113,401 | -- | |
| Wells Fargo Bank Na | $113,401 | -- | |
| Danyl Pass | $104,900 | -- |
Source: Public Records
Mortgage History
| Date | Status | Borrower | Loan Amount |
|---|---|---|---|
| Open | Smith Vernon C | $72,346 | |
| Previous Owner | Danyl Pass | $104,077 |
Source: Public Records
Tax History Compared to Growth
Tax History
| Year | Tax Paid | Tax Assessment Tax Assessment Total Assessment is a certain percentage of the fair market value that is determined by local assessors to be the total taxable value of land and additions on the property. | Land | Improvement |
|---|---|---|---|---|
| 2024 | $1,893 | $76,520 | $5,040 | $71,480 |
| 2023 | $1,769 | $71,640 | $5,040 | $66,600 |
| 2022 | $1,755 | $66,960 | $5,040 | $61,920 |
| 2021 | $1,490 | $55,200 | $5,040 | $50,160 |
| 2020 | $1,540 | $55,760 | $5,040 | $50,720 |
| 2019 | $1,548 | $55,760 | $5,040 | $50,720 |
| 2018 | $1,258 | $45,680 | $5,040 | $40,640 |
| 2017 | $1,228 | $43,440 | $5,040 | $38,400 |
| 2016 | $1,231 | $43,440 | $5,040 | $38,400 |
| 2015 | $1,221 | $42,720 | $5,040 | $37,680 |
| 2014 | $1,132 | $40,878 | $5,040 | $35,838 |
Source: Public Records
Map
Nearby Homes
- 137 Hunters Trail SE
- 408 Peachtree Ln SE
- 194 Cardinal Blvd SE
- 4134 Dews Pond Rd SE
- 192 Cardinal Blvd SE
- 0 Buck Blvd SE Unit 7362017
- 0 Buck Blvd SE Unit 10275210
- 170 Willow Haven St SE
- 127 Alex Ct
- 187 Willow Haven St SE
- 177 Frix Ln SE
- 191 Frix Ln SE
- 130 Burnt Hickory Ln SE
- 170 Erica Ln SE
- 0 Libby Ln SE Unit 10275212
- 0 Libby Ln SE Unit 7362041
- 279 Baker Rd SE
- 3171 Dews Pond Rd SE
- 0 Hunts Gin Rd L2
- 333 Pathfinder Cir SE
- 321 Pathfinder Cir SE
- 322 SE Pathfinder Cir
- 374 Pathfinder Cir SE
- 322 Pathfinder Cir SE
- 317 Pathfinder Cir SE
- 355 Pathfinder Cir SE
- 342 Pathfinder Cir SE
- 314 Pathfinder Cir SE
- 125 Clairmount Dr SE
- 273 Clairmount Dr SE
- 354 Pathfinder Cir SE
- 145 Clairmount Dr SE
- 165 Clairmount Dr SE
- 169 Clairmount Dr SE
- 366 Pathfinder Cir SE
- 0 Clairmont Dr
- 202 Pathfinder Cir SE
- 214 Pathfinder Cir SE
- 192 Pathfinder Cir SE