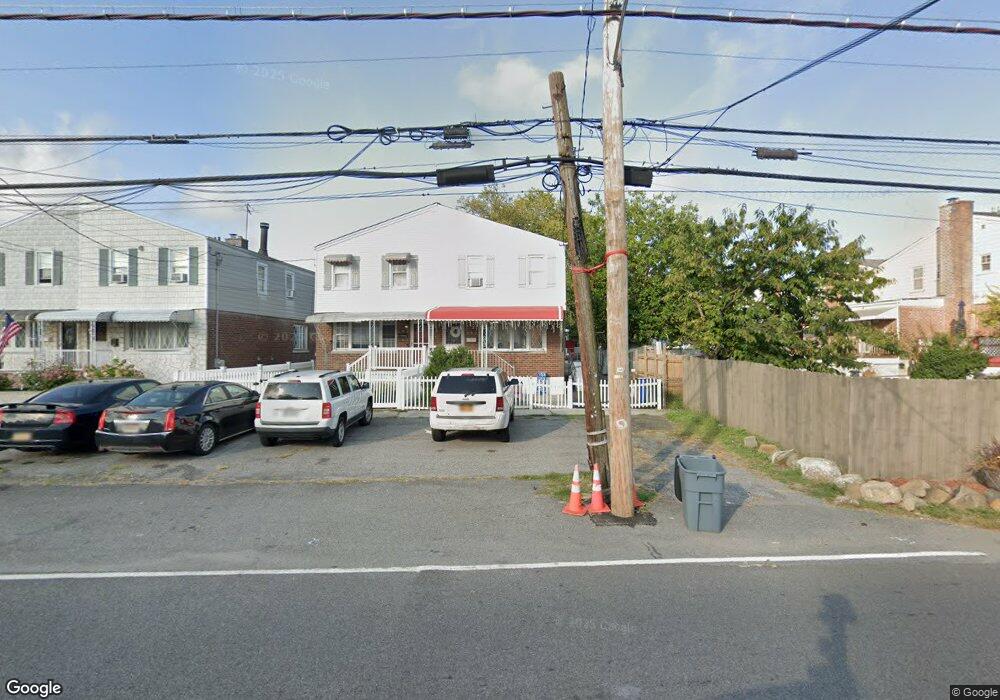
343 Pennyfield Ave Bronx, NY 10465
Throgs Neck-Edgewater Park NeighborhoodEstimated Value: $611,000 - $718,000
--
Bed
--
Bath
1,188
Sq Ft
$562/Sq Ft
Est. Value
About This Home
This home is located at 343 Pennyfield Ave, Bronx, NY 10465 and is currently estimated at $667,179, approximately $561 per square foot. 343 Pennyfield Ave is a home located in Bronx County with nearby schools including P.S. 72 - Dr. William Dorney, Herbert H Lehman High School, and St. Frances de Chantal School.
Ownership History
Date
Name
Owned For
Owner Type
Purchase Details
Closed on
Oct 22, 2008
Sold by
Ramkissoon Chandrawattie and Ramkissoon Lokenat
Bought by
Berenguer Inez
Current Estimated Value
Purchase Details
Closed on
Jan 9, 2002
Sold by
Ramkissoon Lokenat and Ramkissoon Chandrawatti
Bought by
Ramkissoon Lokenat and Ramkissoon Chandrawatti
Home Financials for this Owner
Home Financials are based on the most recent Mortgage that was taken out on this home.
Original Mortgage
$34,444
Interest Rate
6.91%
Purchase Details
Closed on
Oct 16, 1996
Sold by
Rodriguez Jose M and Rodriguez Linda
Bought by
Ramkissoon Lokenat and Ramkissoon Chandrawattie
Home Financials for this Owner
Home Financials are based on the most recent Mortgage that was taken out on this home.
Original Mortgage
$166,500
Interest Rate
7.99%
Create a Home Valuation Report for This Property
The Home Valuation Report is an in-depth analysis detailing your home's value as well as a comparison with similar homes in the area
Home Values in the Area
Average Home Value in this Area
Purchase History
| Date | Buyer | Sale Price | Title Company |
|---|---|---|---|
| Berenguer Inez | $400,000 | -- | |
| Berenguer Inez | $400,000 | -- | |
| Ramkissoon Lokenat | -- | -- | |
| Ramkissoon Lokenat | -- | -- | |
| Ramkissoon Lokenat | $185,000 | Commonwealth Land Title Ins | |
| Ramkissoon Lokenat | $185,000 | Commonwealth Land Title Ins |
Source: Public Records
Mortgage History
| Date | Status | Borrower | Loan Amount |
|---|---|---|---|
| Previous Owner | Ramkissoon Lokenat | $34,444 | |
| Previous Owner | Ramkissoon Lokenat | $166,500 | |
| Closed | Berenguer Inez | $0 |
Source: Public Records
Tax History Compared to Growth
Tax History
| Year | Tax Paid | Tax Assessment Tax Assessment Total Assessment is a certain percentage of the fair market value that is determined by local assessors to be the total taxable value of land and additions on the property. | Land | Improvement |
|---|---|---|---|---|
| 2025 | $6,331 | $33,410 | $9,571 | $23,839 |
| 2024 | $6,331 | $31,519 | $9,776 | $21,743 |
| 2023 | $6,039 | $29,736 | $7,926 | $21,810 |
| 2022 | $5,936 | $37,560 | $9,900 | $27,660 |
| 2021 | $6,046 | $30,480 | $9,900 | $20,580 |
| 2020 | $5,893 | $28,320 | $9,900 | $18,420 |
| 2019 | $5,495 | $28,320 | $9,900 | $18,420 |
| 2018 | $5,051 | $24,780 | $9,900 | $14,880 |
| 2017 | $5,173 | $25,376 | $9,409 | $15,967 |
| 2016 | $4,786 | $23,940 | $9,900 | $14,040 |
| 2015 | $3,100 | $23,220 | $10,980 | $12,240 |
| 2014 | $3,100 | $22,500 | $10,980 | $11,520 |
Source: Public Records
Map
Nearby Homes
- 3095 Mullan Place
- 3088 Mullan Place
- 184 Kearney Ave
- 1 Oak Ave Unit 1
- 230 Pennyfield Ave
- 236 Meagher Ave
- 2973 Harding Ave
- 9 Magnolia Place Unit 1
- 101 Longstreet Ave
- 250 Kearney Ave
- 1 Patricia Ln Unit 209
- 248 Throggs Neck Blvd
- 9 Acorn Place Unit 9
- 3 Acorn Place Unit 3
- 6 Beech Place Unit 6
- 3950 Throgs Neck Expy
- 258A Longstreet Ave
- 258 Longstreet Ave
- 3204 Glennon Place
- 4246 E Tremont Ave Unit MF
- 341 Pennyfield Ave
- 339 Pennyfield Ave
- 337 Pennyfield Ave
- 3066 Harding Ave
- 3064 Harding Ave
- 3068 Harding Ave
- 3062 Harding Ave
- 3060 Harding Ave
- 335 Pennyfield Ave
- 158 Meagher Ave
- 156 Meagher Ave
- 3058 Harding Ave
- 154 Meagher Ave
- 160 Meagher Ave
- 152 Meagher Ave
- 333 Pennyfield Ave
- 3056 Harding Ave
- 150 Meagher Ave
- 3054 Harding Ave
- 331 Pennyfield Ave