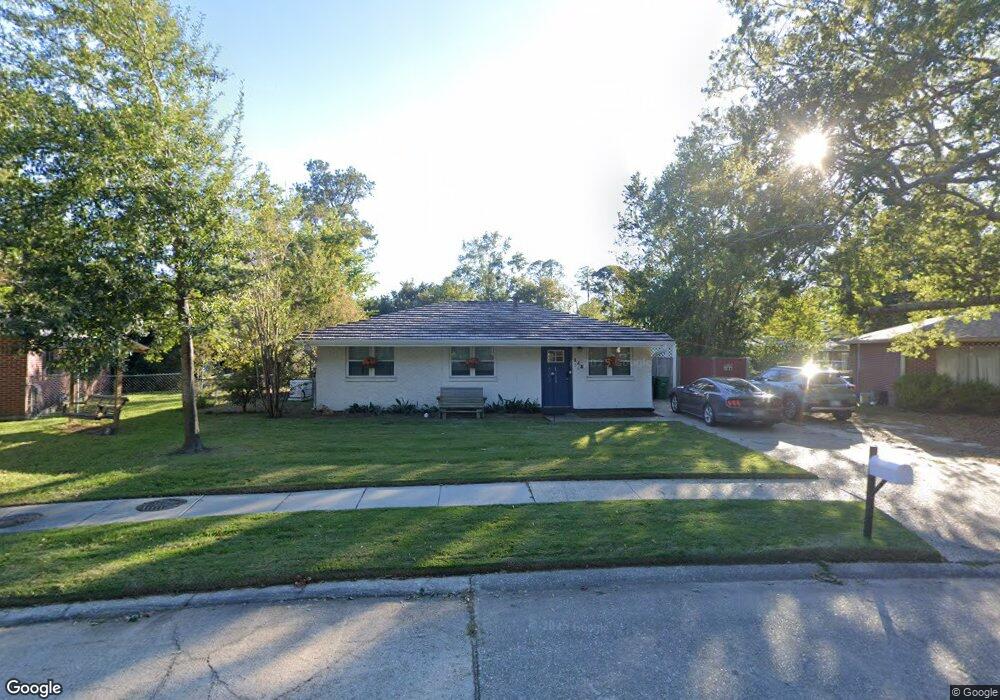
343 Pheasant Ln Slidell, LA 70458
Estimated Value: $156,000 - $189,000
3
Beds
2
Baths
1,050
Sq Ft
$161/Sq Ft
Est. Value
About This Home
This home is located at 343 Pheasant Ln, Slidell, LA 70458 and is currently estimated at $169,326, approximately $161 per square foot. 343 Pheasant Ln is a home located in St. Tammany Parish with nearby schools including Bonne Ecole Elementary School, Slidell Junior High School, and Slidell High School.
Ownership History
Date
Name
Owned For
Owner Type
Purchase Details
Closed on
Aug 17, 2023
Sold by
Bmrc Properties Llc
Bought by
Sawyer Noah Matthew
Current Estimated Value
Home Financials for this Owner
Home Financials are based on the most recent Mortgage that was taken out on this home.
Original Mortgage
$174,600
Outstanding Balance
$169,931
Interest Rate
6.81%
Mortgage Type
New Conventional
Estimated Equity
-$605
Purchase Details
Closed on
Jun 13, 2022
Sold by
Sheriff Of The Parish Of St Tammany Stat
Bought by
Bmrc Properties Llc
Purchase Details
Closed on
Nov 2, 2015
Sold by
M & V Llc
Bought by
Luke Ginger Joyner and Luke Rickie Salvadore
Create a Home Valuation Report for This Property
The Home Valuation Report is an in-depth analysis detailing your home's value as well as a comparison with similar homes in the area
Home Values in the Area
Average Home Value in this Area
Purchase History
| Date | Buyer | Sale Price | Title Company |
|---|---|---|---|
| Sawyer Noah Matthew | $180,000 | Title Management Group | |
| Bmrc Properties Llc | $109,100 | None Listed On Document | |
| Luke Ginger Joyner | $6,500 | Fidelity National Title |
Source: Public Records
Mortgage History
| Date | Status | Borrower | Loan Amount |
|---|---|---|---|
| Open | Sawyer Noah Matthew | $174,600 |
Source: Public Records
Tax History
| Year | Tax Paid | Tax Assessment Tax Assessment Total Assessment is a certain percentage of the fair market value that is determined by local assessors to be the total taxable value of land and additions on the property. | Land | Improvement |
|---|---|---|---|---|
| 2025 | $320 | $8,380 | $1,500 | $6,880 |
| 2024 | $320 | $8,380 | $1,500 | $6,880 |
| 2023 | $363 | $7,724 | $1,500 | $6,224 |
| 2022 | $27,172 | $7,724 | $1,500 | $6,224 |
| 2021 | $272 | $7,724 | $1,500 | $6,224 |
| 2020 | $272 | $7,724 | $1,500 | $6,224 |
| 2019 | $1,323 | $7,476 | $2,000 | $5,476 |
| 2018 | $1,327 | $7,476 | $2,000 | $5,476 |
| 2017 | $1,335 | $7,476 | $2,000 | $5,476 |
| 2016 | $1,365 | $7,476 | $2,000 | $5,476 |
| 2015 | $203 | $7,276 | $1,800 | $5,476 |
| 2014 | $227 | $7,276 | $1,800 | $5,476 |
| 2013 | -- | $7,276 | $1,800 | $5,476 |
Source: Public Records
Map
Nearby Homes
- 345 Pheasant Ln
- 341 Pheasant Ln
- 347 Pheasant Ln
- 339 Pheasant Ln
- 344 Pheasant Ln
- 340 Pheasant Ln
- 349 Pheasant Ln
- 230 Bluebird Dr
- 226 Bluebird Dr
- 337 Pheasant Ln
- 232 Bluebird Dr
- 338 Pheasant Ln
- 302 Robin Ln
- 220 Bluebird Dr
- 304 Robin Ln
- 234 Bluebird Dr
- 348 Pheasant Ln
- 351 Pheasant Ln
- 0 Pheasant Ln
- 216 Bluebird Dr
Your Personal Tour Guide
Ask me questions while you tour the home.