Estimated Value: $363,000 - $397,842
2
Beds
3
Baths
2,300
Sq Ft
$164/Sq Ft
Est. Value
About This Home
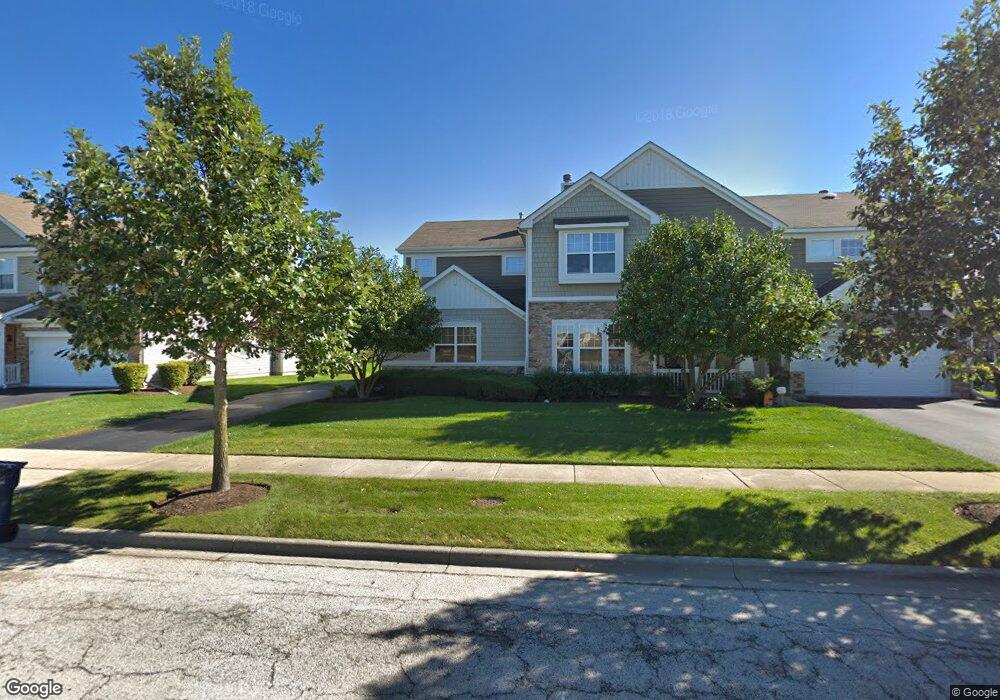
This home is located at 343 Red Rock Ln, Elgin, IL 60124 and is currently estimated at $376,711, approximately $163 per square foot. 343 Red Rock Ln is a home located in Kane County with nearby schools including Prairie View Grade School, Prairie Knolls Middle School, and Central Middle School.
Ownership History
Date
Name
Owned For
Owner Type
Purchase Details
Closed on
Feb 25, 2016
Sold by
Mortgage Company Llc
Bought by
Ahmed Rashid
Current Estimated Value
Purchase Details
Closed on
Mar 19, 2015
Sold by
Jpmorgan Chase Bank Na
Bought by
Ctx Mortgage Company Llc
Purchase Details
Closed on
Dec 19, 2013
Sold by
Federal National Mortgage Association
Bought by
Jpmorgan Chase Bank Na
Purchase Details
Closed on
Jul 1, 2013
Sold by
Vilayphanh Douangmala
Bought by
Federal National Mortgage Association
Purchase Details
Closed on
Aug 1, 2007
Sold by
Centex Homes
Bought by
Vilayphanh Douangmala
Home Financials for this Owner
Home Financials are based on the most recent Mortgage that was taken out on this home.
Original Mortgage
$285,980
Interest Rate
6.55%
Mortgage Type
Purchase Money Mortgage
Create a Home Valuation Report for This Property
The Home Valuation Report is an in-depth analysis detailing your home's value as well as a comparison with similar homes in the area
Home Values in the Area
Average Home Value in this Area
Purchase History
| Date | Buyer | Sale Price | Title Company |
|---|---|---|---|
| Ahmed Rashid | -- | Servicelink Llc | |
| Ctx Mortgage Company Llc | $413,500 | None Available | |
| Jpmorgan Chase Bank Na | -- | First American Title Ins Co | |
| Federal National Mortgage Association | -- | None Available | |
| Vilayphanh Douangmala | $286,000 | Chicago Title Insurance Co |
Source: Public Records
Mortgage History
| Date | Status | Borrower | Loan Amount |
|---|---|---|---|
| Previous Owner | Vilayphanh Douangmala | $285,980 |
Source: Public Records
Tax History Compared to Growth
Tax History
| Year | Tax Paid | Tax Assessment Tax Assessment Total Assessment is a certain percentage of the fair market value that is determined by local assessors to be the total taxable value of land and additions on the property. | Land | Improvement |
|---|---|---|---|---|
| 2024 | $8,919 | $101,567 | $28,981 | $72,586 |
| 2023 | $8,607 | $91,758 | $26,182 | $65,576 |
| 2022 | $8,016 | $83,667 | $23,873 | $59,794 |
| 2021 | $7,781 | $78,223 | $22,320 | $55,903 |
| 2020 | $7,576 | $74,676 | $21,308 | $53,368 |
| 2019 | $7,369 | $71,133 | $20,297 | $50,836 |
| 2018 | $7,019 | $67,012 | $19,121 | $47,891 |
| 2017 | $6,782 | $63,350 | $18,076 | $45,274 |
| 2016 | $6,795 | $58,772 | $16,770 | $42,002 |
| 2015 | -- | $53,870 | $15,371 | $38,499 |
| 2014 | -- | $50,280 | $15,181 | $35,099 |
| 2013 | -- | $51,606 | $15,581 | $36,025 |
Source: Public Records
Map
Nearby Homes
- 415 Victoria Ln
- 343 Tracy Ln
- 343 Copper Springs Ln
- 433 Acushnet St
- 360 Fountain Ave
- LOT 100 South St
- 289 Monument Rd
- 003 South St
- 233 Pawtucket Ave
- 300 Monument Rd
- 10N085 Trails End
- 244 Prescott Ave
- 3086 Wickenden Ave
- 3116 Taunton St
- Wren Plan at Waterford - Horizon
- Rainier Plan at Waterford - Horizon
- Townsend Plan at Waterford - Horizon
- Starling Plan at Waterford - Horizon
- Mesa Verde Plan at Waterford - Horizon
- Bluestone Plan at Waterford - Hartford Series
- 343 Red Rock Ln
- 341 Red Rock Ln
- 345 Red Rock Ln
- 347 Red Rock Ln
- 348 Victoria Ln
- 339 Red Rock Ln
- 346 Victoria Ln
- 350 Victoria Ln
- 344 Victoria Ln
- 352 Victoria Ln
- 349 Red Rock Ln
- 349 Red Rock Ln Unit 218
- 342 Victoria Ln
- 354 Victoria Ln
- 340 Victoria Ln
- 349 Victoria Ln
- 349 Victoria Ln Unit 349
- 347 Victoria Ln
- 351 Victoria Ln
- 338 Red Rock Ln