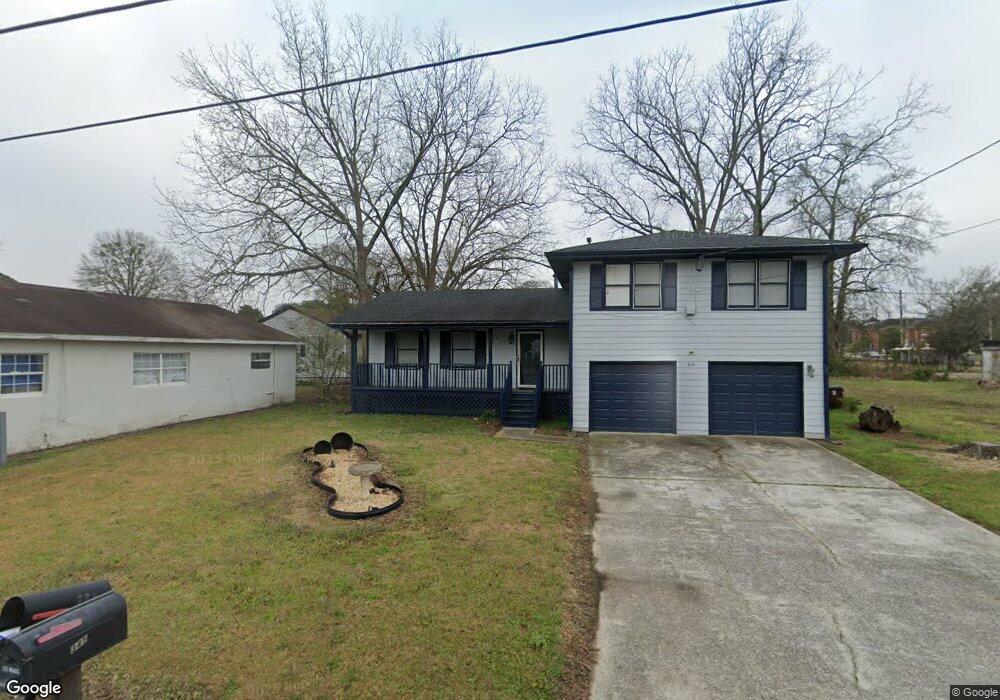
343 Rogers St McDonough, GA 30253
Estimated Value: $193,270 - $274,000
4
Beds
2
Baths
1,442
Sq Ft
$155/Sq Ft
Est. Value
About This Home
This home is located at 343 Rogers St, McDonough, GA 30253 and is currently estimated at $224,068, approximately $155 per square foot. 343 Rogers St is a home located in Henry County with nearby schools including Tussahaw Elementary School, McDonough Middle School, and McDonough Methodist Academy.
Ownership History
Date
Name
Owned For
Owner Type
Purchase Details
Closed on
May 12, 2021
Sold by
Txo Investment Grp Llc
Bought by
4649 Burk Property Holdings Llc
Current Estimated Value
Purchase Details
Closed on
Sep 13, 2019
Sold by
Property Problem Solvers Llc
Bought by
Txo Investment Grp Llc
Home Financials for this Owner
Home Financials are based on the most recent Mortgage that was taken out on this home.
Original Mortgage
$125,000
Interest Rate
3.6%
Mortgage Type
New Conventional
Purchase Details
Closed on
Mar 21, 2019
Sold by
Harding Construction Inc
Bought by
Property Problem Solvers Llc
Purchase Details
Closed on
Aug 13, 2012
Sold by
Cheek David A
Bought by
Shelton Paul
Purchase Details
Closed on
Jan 7, 1997
Sold by
Penn Raleigh
Bought by
Consinc Harding
Create a Home Valuation Report for This Property
The Home Valuation Report is an in-depth analysis detailing your home's value as well as a comparison with similar homes in the area
Home Values in the Area
Average Home Value in this Area
Purchase History
| Date | Buyer | Sale Price | Title Company |
|---|---|---|---|
| 4649 Burk Property Holdings Llc | -- | -- | |
| Txo Investment Grp Llc | $120,000 | -- | |
| Property Problem Solvers Llc | -- | -- | |
| Property Problem Solvers Llc | $37,216 | -- | |
| Shelton Paul | -- | -- | |
| Consinc Harding | $40,000 | -- |
Source: Public Records
Mortgage History
| Date | Status | Borrower | Loan Amount |
|---|---|---|---|
| Previous Owner | Txo Investment Grp Llc | $125,000 | |
| Closed | Consinc Harding | $0 |
Source: Public Records
Tax History Compared to Growth
Tax History
| Year | Tax Paid | Tax Assessment Tax Assessment Total Assessment is a certain percentage of the fair market value that is determined by local assessors to be the total taxable value of land and additions on the property. | Land | Improvement |
|---|---|---|---|---|
| 2024 | $5,275 | $69,360 | $0 | $69,360 |
| 2023 | $4,161 | $62,720 | $0 | $62,720 |
| 2022 | $3,026 | $78,680 | $8,000 | $70,680 |
| 2021 | $2,205 | $55,920 | $7,040 | $48,880 |
| 2020 | $1,895 | $47,680 | $6,400 | $41,280 |
| 2019 | $1,471 | $35,760 | $6,400 | $29,360 |
| 2018 | $0 | $31,280 | $4,800 | $26,480 |
| 2016 | $1,166 | $32,760 | $4,800 | $27,960 |
| 2015 | -- | $20,920 | $4,800 | $16,120 |
| 2014 | $800 | $18,400 | $4,800 | $13,600 |
Source: Public Records
Map
Nearby Homes
- 145 Dean Cir
- 201 Rogers St
- 209 Maison Dr
- 0 Simpson St Unit 10304156
- 177 Maison Dr
- 181 Maison Dr
- 189 Maison Dr
- 193 Maison Dr
- 177 College St
- 156 Maison Dr
- 114 Bryan St
- 161 Carver Rd
- 209 Bryan St
- 58 Washington St
- 000 Keys Ferry St
- 00 Keys Ferry St
- Braddock Plan at Anderson Point - Estates
- Liston Plan at Anderson Point - Estates
- Tunney Plan at Anderson Point - Estates
- Dempsey Plan at Anderson Point - Estates
- 345 Rogers St
- 347 Rogers St
- 338 Rogers St
- 346 Rogers St
- 336 Macon St Unit A-D
- 0 Rodgers St Unit 7510057
- 0 Rodgers St Unit 8432503
- 0 Rodgers St Unit 8715189
- 0 Rodgers St Unit 8751682
- 0 Rodgers St Unit 8883017
- 0 Rodgers St Unit 7232600
- 0 Rodgers St Unit 7250477
- 0 Rodgers St Unit 7344795
- 0 Rodgers St Unit 7401244
- 0 Rodgers St Unit 8320027
- 0 Rodgers St Unit 8379812
- 0 Rodgers St Unit 8548887
- 0 Rodgers St Unit 4
- 334 Rogers St
- 328 Macon St