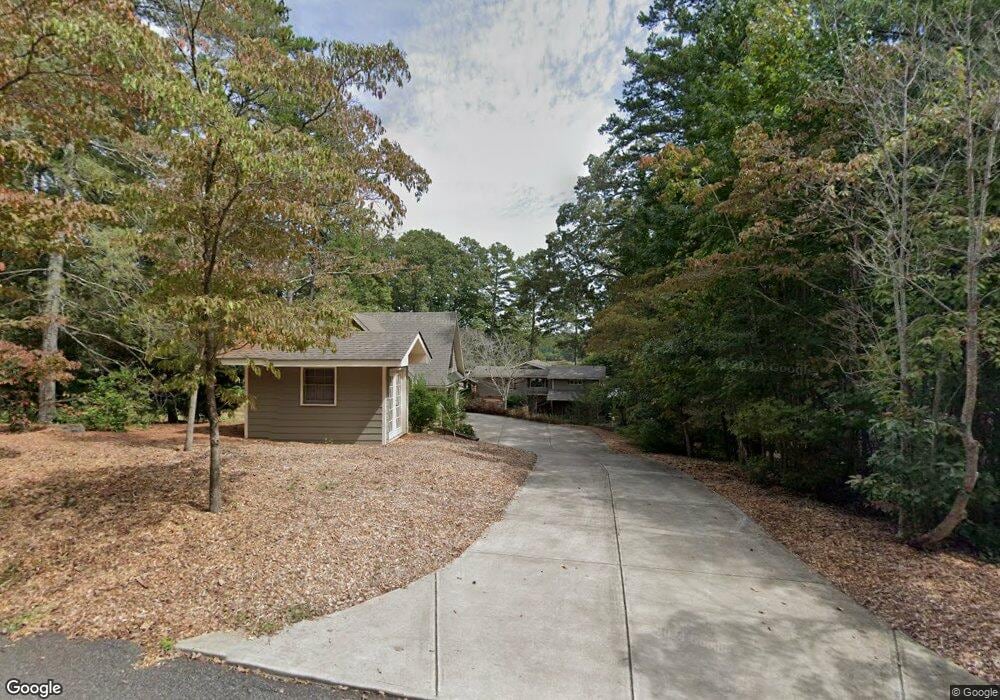
343 Shore Dr Dahlonega, GA 30533
Estimated Value: $441,000 - $869,000
--
Bed
3
Baths
1,914
Sq Ft
$305/Sq Ft
Est. Value
About This Home
This home is located at 343 Shore Dr, Dahlonega, GA 30533 and is currently estimated at $584,023, approximately $305 per square foot. 343 Shore Dr is a home located in Lumpkin County with nearby schools including Lumpkin County High School.
Ownership History
Date
Name
Owned For
Owner Type
Purchase Details
Closed on
Mar 28, 1997
Sold by
Johnson Travis W
Bought by
Nearpass William Edw
Current Estimated Value
Purchase Details
Closed on
Jan 31, 1997
Sold by
Johnson Travis W
Bought by
Johnson Travis W
Purchase Details
Closed on
Jun 25, 1993
Bought by
Johnson Travis W
Create a Home Valuation Report for This Property
The Home Valuation Report is an in-depth analysis detailing your home's value as well as a comparison with similar homes in the area
Home Values in the Area
Average Home Value in this Area
Purchase History
| Date | Buyer | Sale Price | Title Company |
|---|---|---|---|
| Nearpass William Edw | $115,500 | -- | |
| Johnson Travis W | -- | -- | |
| Johnson Travis W | -- | -- |
Source: Public Records
Tax History Compared to Growth
Tax History
| Year | Tax Paid | Tax Assessment Tax Assessment Total Assessment is a certain percentage of the fair market value that is determined by local assessors to be the total taxable value of land and additions on the property. | Land | Improvement |
|---|---|---|---|---|
| 2024 | $2,360 | $205,843 | $60,000 | $145,843 |
| 2023 | $1,748 | $197,398 | $60,000 | $137,398 |
| 2022 | $1,998 | $184,338 | $60,000 | $124,338 |
| 2021 | $1,591 | $166,626 | $60,000 | $106,626 |
| 2020 | $1,570 | $164,315 | $60,000 | $104,315 |
| 2019 | $1,597 | $164,315 | $60,000 | $104,315 |
| 2018 | $1,442 | $154,404 | $60,000 | $94,404 |
| 2017 | $1,491 | $154,417 | $60,000 | $94,417 |
| 2016 | $1,398 | $148,493 | $60,000 | $88,493 |
| 2015 | $1,414 | $134,454 | $60,000 | $74,454 |
| 2014 | $1,414 | $125,066 | $60,000 | $65,066 |
| 2013 | -- | $125,994 | $60,000 | $65,994 |
Source: Public Records
Map
Nearby Homes
- 7804 Poplar Place
- 7606 Pine Place
- 7828 Beachwood Dr
- 7836 Beachwood Dr
- 5441 Oak Manor Way
- 5425 Oak Manor Way
- 5421 Oak Manor Way
- 5440 Oak Manor Way
- 5409 Oak Manor Way
- 5405 Oak Manor Way
- 5441 Oak Manor Way Unit LOT 13
- 5405 Oak Manor Way Unit LOT 22
- 5409 Oak Manor Way Unit LOT 21
- 5440 Oak Manor Way Unit LOT 10
- 5421 Oak Manor Way Unit LOT 18
- 5425 Oak Manor Way Unit LOT 17
- 35 Kitchen Way W
- 60 Dogwood Ln
- 7527 Magnolia Ln
- 7457 Dogwood Trail