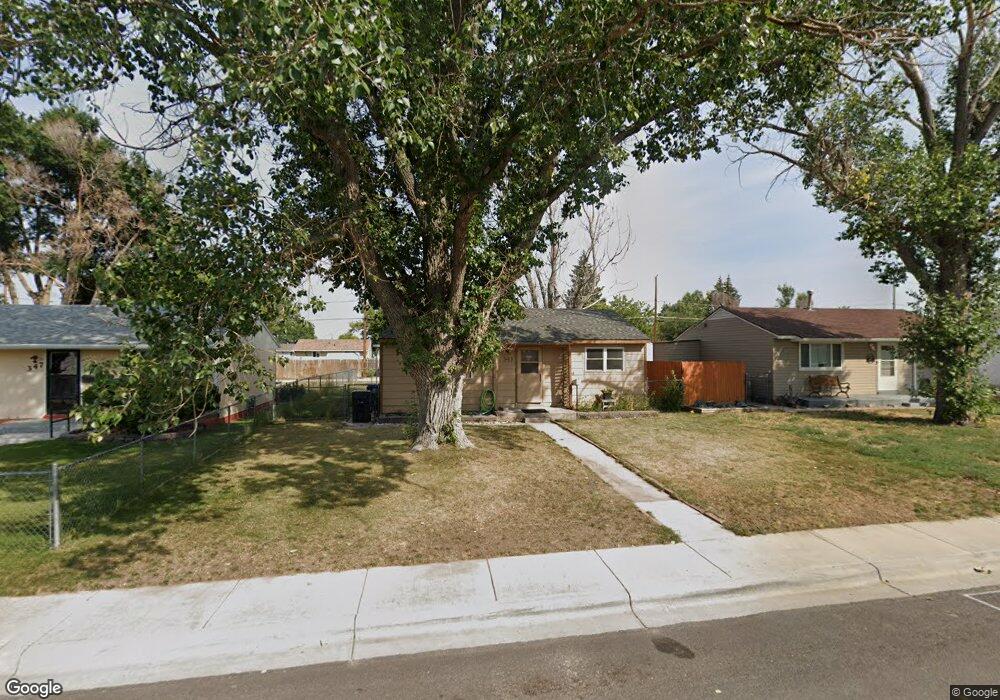
343 Stinson Ave Cheyenne, WY 82007
Estimated Value: $228,000 - $243,732
2
Beds
1
Bath
759
Sq Ft
$309/Sq Ft
Est. Value
About This Home
This home is located at 343 Stinson Ave, Cheyenne, WY 82007 and is currently estimated at $234,683, approximately $309 per square foot. 343 Stinson Ave is a home located in Laramie County with nearby schools including Cole Elementary School, Johnson Junior High School, and South High School.
Ownership History
Date
Name
Owned For
Owner Type
Purchase Details
Closed on
Feb 24, 2011
Sold by
Federal Home Loan Mortgage Corporation
Bought by
Carroll Trent D
Current Estimated Value
Home Financials for this Owner
Home Financials are based on the most recent Mortgage that was taken out on this home.
Original Mortgage
$48,800
Outstanding Balance
$33,515
Interest Rate
4.78%
Mortgage Type
New Conventional
Estimated Equity
$201,168
Purchase Details
Closed on
Oct 11, 2010
Sold by
Baker Kyle D
Bought by
Federal Home Loan Mortgage Corp
Purchase Details
Closed on
Jun 1, 2010
Sold by
Baker Kyle D
Bought by
Bac Home Loans Servicing L P
Purchase Details
Closed on
Feb 22, 2006
Sold by
Pimentel William G
Bought by
Baker Kyle D
Purchase Details
Closed on
Nov 27, 2000
Sold by
Va
Bought by
Pimentel William G
Home Financials for this Owner
Home Financials are based on the most recent Mortgage that was taken out on this home.
Original Mortgage
$48,619
Interest Rate
7.72%
Mortgage Type
FHA
Purchase Details
Closed on
Jun 7, 2000
Sold by
Muter William G
Bought by
Va
Purchase Details
Closed on
May 4, 2000
Sold by
Irwin Mtg Corp
Bought by
Va
Create a Home Valuation Report for This Property
The Home Valuation Report is an in-depth analysis detailing your home's value as well as a comparison with similar homes in the area
Home Values in the Area
Average Home Value in this Area
Purchase History
| Date | Buyer | Sale Price | Title Company |
|---|---|---|---|
| Carroll Trent D | -- | Chicago Title Servicelink Di | |
| Federal Home Loan Mortgage Corp | $71,557 | None Available | |
| Bac Home Loans Servicing L P | $71,557 | None Available | |
| Baker Kyle D | -- | None Available | |
| Pimentel William G | -- | -- | |
| Va | $44,947 | -- | |
| Va | -- | -- |
Source: Public Records
Mortgage History
| Date | Status | Borrower | Loan Amount |
|---|---|---|---|
| Open | Carroll Trent D | $48,800 | |
| Previous Owner | Pimentel William G | $48,619 |
Source: Public Records
Tax History Compared to Growth
Tax History
| Year | Tax Paid | Tax Assessment Tax Assessment Total Assessment is a certain percentage of the fair market value that is determined by local assessors to be the total taxable value of land and additions on the property. | Land | Improvement |
|---|---|---|---|---|
| 2025 | $1,241 | $12,933 | $2,387 | $10,546 |
| 2024 | $1,241 | $17,554 | $3,183 | $14,371 |
| 2023 | $1,202 | $17,001 | $3,183 | $13,818 |
| 2022 | $1,108 | $15,354 | $3,183 | $12,171 |
| 2021 | $959 | $13,256 | $3,183 | $10,073 |
| 2020 | $908 | $12,590 | $3,183 | $9,407 |
| 2019 | $896 | $12,412 | $3,183 | $9,229 |
| 2018 | $749 | $10,473 | $2,405 | $8,068 |
| 2017 | $722 | $10,000 | $2,405 | $7,595 |
| 2016 | $681 | $9,430 | $2,347 | $7,083 |
| 2015 | $673 | $9,318 | $2,347 | $6,971 |
| 2014 | $666 | $9,162 | $2,347 | $6,815 |
Source: Public Records
Map
Nearby Homes
- 257 Mccomb Ave
- 227 Hynds Ave
- 205 Mccomb Ave
- 240 Patton Ave
- TBD Snyder Ave
- 302 Abby Rd
- 125 King Ct
- TBD Arkel Way
- 509 Bent Ave
- 615 W 7th St
- 1122 W Leisher Rd
- 1106 W Leisher Rd
- 6216 Highway 30
- 1504 Woodward Dr
- Lot 6 Blk 1 Paul Smith Way
- Lot 5 Blk 1 Paul Smith Way
- 607 Stanfield Ave
- TBD Wyott Dr
- 517 W 6th St
- 119 Stanfield Ave
- 337 Stinson Ave
- 347 Stinson Ave
- 333 Stinson Ave
- 353 Stinson Ave
- 340 Mccomb Ave
- 336 Mccomb Ave
- 344 Mccomb Ave
- 327 Stinson Ave
- 357 Stinson Ave
- 332 Mccomb Ave
- 350 Mccomb Ave
- 340 Stinson Ave
- 336 Stinson Ave
- 344 Stinson Ave
- 321 Stinson Ave
- 356 Mccomb Ave
- 350 Stinson Ave
- 332 Stinson Ave
- 326 Stinson Ave
- 356 Stinson Ave