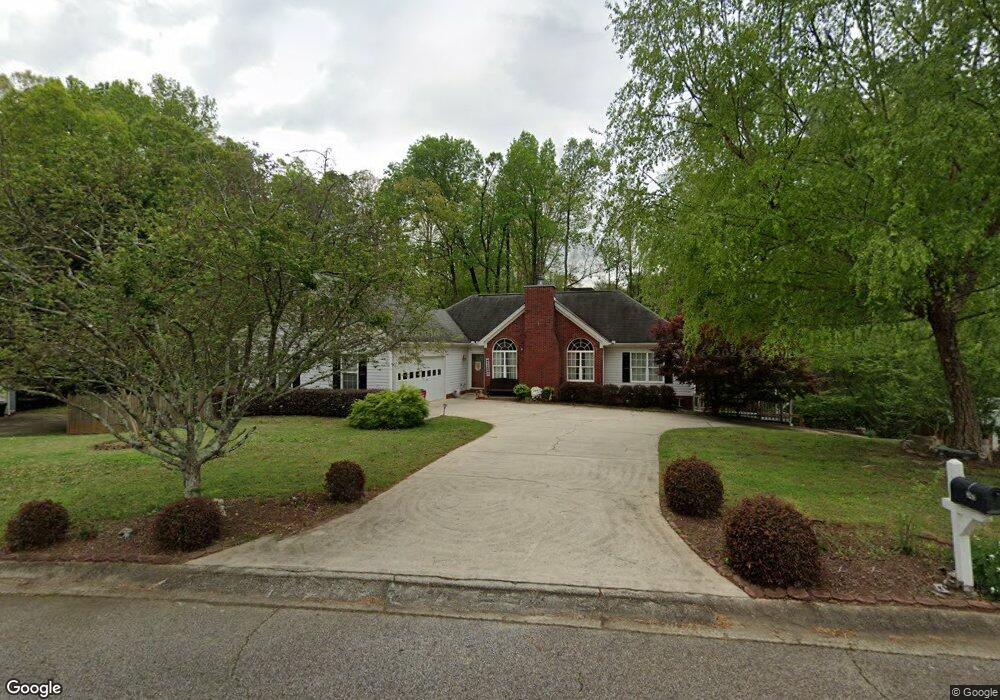
343 Stone View Dr Hoschton, GA 30548
Estimated Value: $338,000 - $397,000
--
Bed
3
Baths
1,582
Sq Ft
$240/Sq Ft
Est. Value
About This Home
This home is located at 343 Stone View Dr, Hoschton, GA 30548 and is currently estimated at $380,215, approximately $240 per square foot. 343 Stone View Dr is a home located in Jackson County with nearby schools including Gum Springs Elementary School, West Jackson Middle School, and Jackson County High School.
Ownership History
Date
Name
Owned For
Owner Type
Purchase Details
Closed on
May 16, 2023
Sold by
Peavy Ronald W
Bought by
Scalera Michael and Scalera Zachary
Current Estimated Value
Home Financials for this Owner
Home Financials are based on the most recent Mortgage that was taken out on this home.
Original Mortgage
$382,783
Outstanding Balance
$373,480
Interest Rate
7.12%
Mortgage Type
FHA
Estimated Equity
$6,735
Purchase Details
Closed on
Dec 30, 2003
Sold by
Peavy Patricia A
Bought by
Peavy Patricia A and Peavy Ronald W
Purchase Details
Closed on
Apr 17, 2003
Sold by
Hood Viola
Bought by
Butler Wendell
Purchase Details
Closed on
Jul 1, 2001
Sold by
Butler Wendell
Bought by
Hood Viola
Purchase Details
Closed on
Jun 1, 2001
Sold by
Butler Wendell
Bought by
Hood Viola
Purchase Details
Closed on
Nov 17, 2000
Sold by
North East Developer
Bought by
Butler Wendell
Purchase Details
Closed on
Apr 1, 1995
Bought by
North East Developer
Create a Home Valuation Report for This Property
The Home Valuation Report is an in-depth analysis detailing your home's value as well as a comparison with similar homes in the area
Home Values in the Area
Average Home Value in this Area
Purchase History
| Date | Buyer | Sale Price | Title Company |
|---|---|---|---|
| Scalera Michael | $396,000 | -- | |
| Peavy Patricia A | -- | -- | |
| Peavy Patricia A | $159,000 | -- | |
| Butler Wendell | $142,500 | -- | |
| Hood Viola | -- | -- | |
| Hood Viola | $142,500 | -- | |
| Butler Wendell | $18,500 | -- | |
| North East Developer | -- | -- |
Source: Public Records
Mortgage History
| Date | Status | Borrower | Loan Amount |
|---|---|---|---|
| Open | Scalera Michael | $382,783 |
Source: Public Records
Tax History Compared to Growth
Tax History
| Year | Tax Paid | Tax Assessment Tax Assessment Total Assessment is a certain percentage of the fair market value that is determined by local assessors to be the total taxable value of land and additions on the property. | Land | Improvement |
|---|---|---|---|---|
| 2024 | $2,497 | $102,920 | $17,520 | $85,400 |
| 2023 | $2,497 | $91,680 | $17,520 | $74,160 |
| 2022 | $1,177 | $76,240 | $17,520 | $58,720 |
| 2021 | $1,066 | $71,800 | $13,080 | $58,720 |
| 2020 | $812 | $60,360 | $8,640 | $51,720 |
| 2019 | $826 | $60,360 | $8,640 | $51,720 |
| 2018 | $762 | $57,880 | $8,640 | $49,240 |
| 2017 | $1,770 | $57,195 | $8,643 | $48,552 |
| 2016 | $1,781 | $57,195 | $8,643 | $48,552 |
| 2015 | $1,576 | $50,620 | $4,380 | $46,240 |
| 2014 | $1,554 | $49,566 | $4,380 | $45,186 |
| 2013 | -- | $45,499 | $4,380 | $41,119 |
Source: Public Records
Map
Nearby Homes
- 343 Stoneview Dr
- 48 Pebble Ct
- 319 Stone View Dr
- 377 Stone View Dr
- 348 Stone View Dr
- 298 Stone View Dr
- 289 Stone View Dr
- 289 Stoneview Dr
- 42 Pebble Ct
- 388 Stoneview Dr
- 298 Stoneview Dr
- 388 Stone View Dr
- 403 Stone View Dr
- 272 Stone View Dr
- 0 Pebble Ct
- 267 Stone View Dr
- 427 Stone View Dr
- 0 Stoneview Dr Unit 7113973
- 0 Stoneview Dr Unit 7179731
- 0 Stoneview Dr Unit 9041556