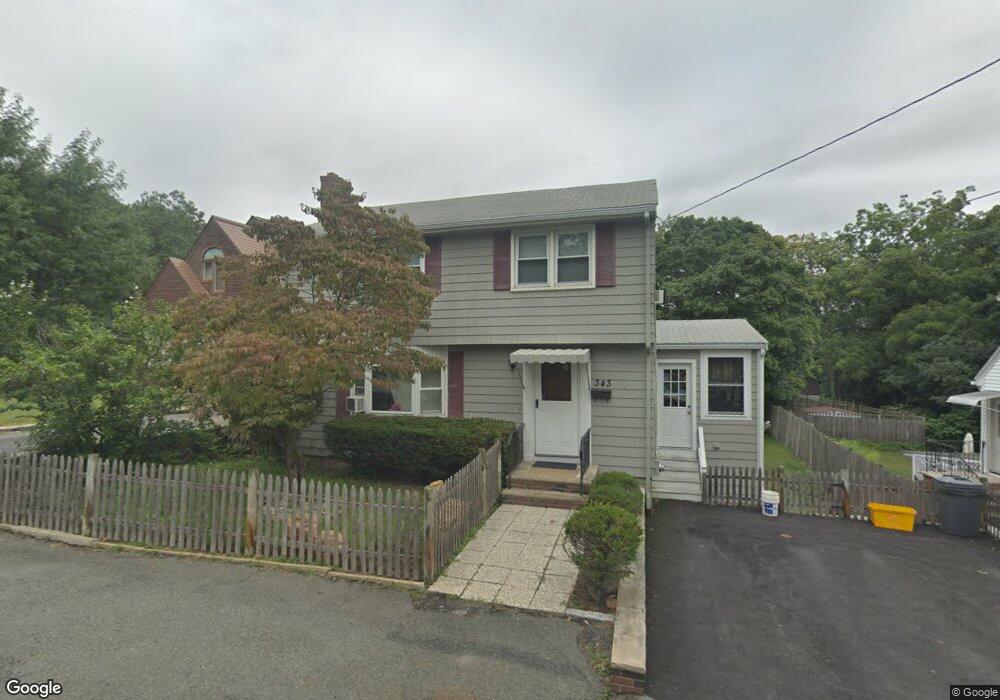
343 Summer St Malden, MA 02148
Oak Grove NeighborhoodEstimated Value: $756,000 - $806,000
3
Beds
2
Baths
1,372
Sq Ft
$565/Sq Ft
Est. Value
About This Home
This home is located at 343 Summer St, Malden, MA 02148 and is currently estimated at $775,520, approximately $565 per square foot. 343 Summer St is a home located in Middlesex County with nearby schools including Malden High School, Mystic Valley Regional Charter School, and Cheverus Catholic School.
Ownership History
Date
Name
Owned For
Owner Type
Purchase Details
Closed on
Feb 7, 2017
Sold by
Dakota Partners Llc
Bought by
351 Summer Llc
Current Estimated Value
Purchase Details
Closed on
Jun 25, 1999
Sold by
Flammia Susan M
Bought by
Daley Steven D and Daley Nelsie
Home Financials for this Owner
Home Financials are based on the most recent Mortgage that was taken out on this home.
Original Mortgage
$193,500
Interest Rate
7.09%
Mortgage Type
Purchase Money Mortgage
Purchase Details
Closed on
Oct 31, 1995
Sold by
Mclean Robert A and Mclean Barbara A
Bought by
Flammia Susan M and Dossantos Antonio E
Purchase Details
Closed on
Jun 1, 1993
Sold by
Trezzy Michael F and Trezzy Jurgielewicz-Trezzy A
Bought by
Mclean Robert A and Mclean Barbara A
Purchase Details
Closed on
Jun 9, 1988
Sold by
Lerra Rose
Bought by
Trezzy Michel J
Create a Home Valuation Report for This Property
The Home Valuation Report is an in-depth analysis detailing your home's value as well as a comparison with similar homes in the area
Home Values in the Area
Average Home Value in this Area
Purchase History
| Date | Buyer | Sale Price | Title Company |
|---|---|---|---|
| Daley Steven D | $215,000 | -- | |
| Flammia Susan M | $153,000 | -- | |
| Flammia Susan M | $153,000 | -- | |
| Mclean Robert A | $146,000 | -- | |
| Mclean Robert A | $146,000 | -- | |
| Trezzy Michel J | $181,500 | -- | |
| 351 Summer Llc | $2,250,000 | -- |
Source: Public Records
Mortgage History
| Date | Status | Borrower | Loan Amount |
|---|---|---|---|
| Previous Owner | Trezzy Michel J | $0 | |
| Previous Owner | Trezzy Michel J | $193,500 |
Source: Public Records
Tax History Compared to Growth
Tax History
| Year | Tax Paid | Tax Assessment Tax Assessment Total Assessment is a certain percentage of the fair market value that is determined by local assessors to be the total taxable value of land and additions on the property. | Land | Improvement |
|---|---|---|---|---|
| 2025 | $71 | $627,000 | $336,500 | $290,500 |
| 2024 | $6,776 | $579,600 | $312,800 | $266,800 |
| 2023 | $6,530 | $535,700 | $284,700 | $251,000 |
| 2022 | $6,268 | $507,500 | $263,100 | $244,400 |
| 2021 | $5,945 | $483,700 | $247,200 | $236,500 |
| 2020 | $5,866 | $463,700 | $235,500 | $228,200 |
| 2019 | $5,595 | $421,600 | $224,300 | $197,300 |
| 2018 | $5,585 | $396,400 | $207,100 | $189,300 |
| 2017 | $5,419 | $382,400 | $198,400 | $184,000 |
| 2016 | $5,221 | $344,400 | $174,700 | $169,700 |
| 2015 | $5,197 | $330,400 | $166,100 | $164,300 |
| 2014 | $4,901 | $304,400 | $151,000 | $153,400 |
Source: Public Records
Map
Nearby Homes
- 38 Greystone Rd
- 256 Summer St
- 91-93 Beltran St
- 35-41 Brazil St
- 1 Glenwood St Unit 3
- 1 Glenwood St Unit 4
- 1 Glenwood St Unit 5
- 55 Vernon St
- 921 Main St
- 161 Washington St
- 311-313 Clifton St
- 131 Linden Ave
- 29 Lincoln St
- 87 Cedar St Unit 10
- 57 Maurice St
- 20 Washington Place
- 53 Maple St
- 18 Orient St
- 41 Mountain Ave
- 124 Bower St
- 339 Summer St
- 359 Summer St
- 359 Summer St Unit House
- 344 Summer St
- 348 Summer St
- 365 Summer St Unit 367
- 356 Summer St
- 338 Summer St
- 373 Summer St
- 38 Upland Rd
- 35 E Border Rd
- 377 Summer St Unit 379
- 370 Summer St Unit 372
- 327 Summer St
- 320 Summer St
- 36 Upland Rd
- 325 Summer St
- 316 Summer St
- 316 Summer St Unit 2nd floor unit
- 43 Upland Rd