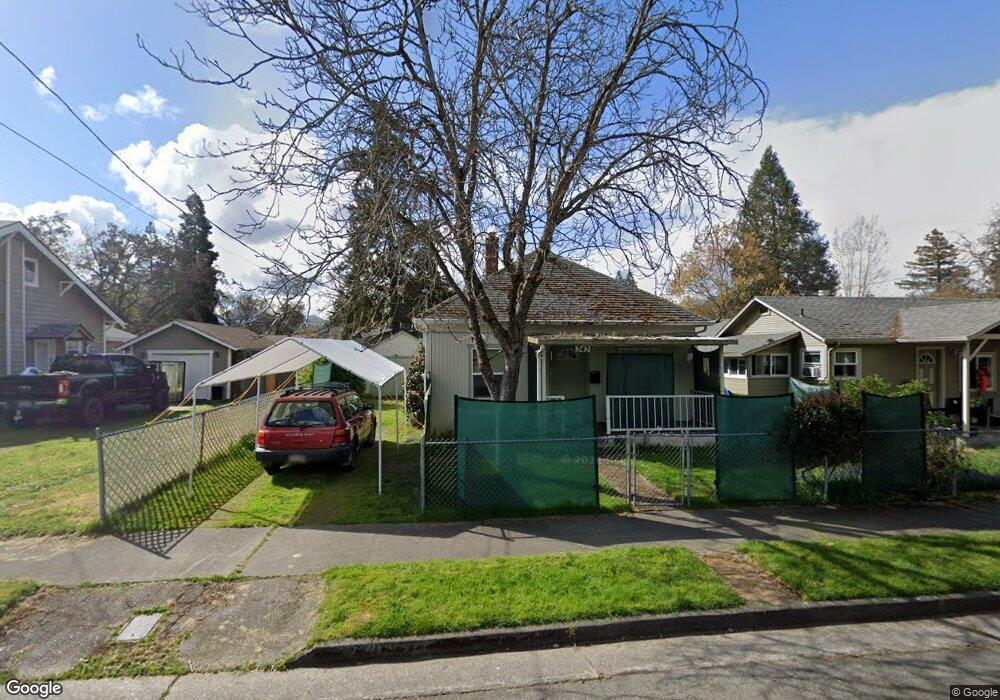
343 SW L St Grants Pass, OR 97526
Estimated Value: $233,000 - $271,183
3
Beds
1
Bath
876
Sq Ft
$288/Sq Ft
Est. Value
About This Home
This home is located at 343 SW L St, Grants Pass, OR 97526 and is currently estimated at $252,092, approximately $287 per square foot. 343 SW L St is a home located in Josephine County with nearby schools including Riverside Elementary School, North Middle School, and Grants Pass High School.
Ownership History
Date
Name
Owned For
Owner Type
Purchase Details
Closed on
Jan 29, 2018
Sold by
Jacobsen Equity Group Llc
Bought by
Jacobsen Chris and Chris E Jacobsen Family Trust
Current Estimated Value
Purchase Details
Closed on
Jan 26, 2018
Sold by
Jacobsen Equity Group Llc
Bought by
Chris E Jacobsen Family Trust and Jacobsen
Purchase Details
Closed on
Jan 10, 2018
Sold by
Jacobsen Chris
Bought by
Chris E Jacobsen Family Trust and Jacobsen
Purchase Details
Closed on
Aug 28, 2006
Sold by
Regester Marguerite E
Bought by
Jacobsen Chris E
Home Financials for this Owner
Home Financials are based on the most recent Mortgage that was taken out on this home.
Original Mortgage
$113,000
Interest Rate
6.76%
Mortgage Type
Purchase Money Mortgage
Create a Home Valuation Report for This Property
The Home Valuation Report is an in-depth analysis detailing your home's value as well as a comparison with similar homes in the area
Home Values in the Area
Average Home Value in this Area
Purchase History
| Date | Buyer | Sale Price | Title Company |
|---|---|---|---|
| Jacobsen Chris | -- | None Available | |
| Chris E Jacobsen Family Trust | -- | None Listed On Document | |
| Chris E Jacobsen Family Trust | -- | None Listed On Document | |
| Jacobsen Chris E | $142,000 | First American Title |
Source: Public Records
Mortgage History
| Date | Status | Borrower | Loan Amount |
|---|---|---|---|
| Previous Owner | Jacobsen Chris E | $113,000 |
Source: Public Records
Tax History Compared to Growth
Tax History
| Year | Tax Paid | Tax Assessment Tax Assessment Total Assessment is a certain percentage of the fair market value that is determined by local assessors to be the total taxable value of land and additions on the property. | Land | Improvement |
|---|---|---|---|---|
| 2025 | $1,435 | $110,460 | -- | -- |
| 2024 | $1,435 | $107,250 | -- | -- |
| 2023 | $1,393 | $104,130 | $0 | $0 |
| 2022 | $1,358 | $101,100 | -- | -- |
| 2021 | $1,275 | $98,160 | $0 | $0 |
| 2020 | $1,238 | $95,310 | $0 | $0 |
| 2019 | $1,203 | $92,540 | $0 | $0 |
| 2018 | $1,224 | $89,850 | $0 | $0 |
| 2017 | $1,215 | $87,240 | $0 | $0 |
| 2016 | $1,068 | $84,700 | $0 | $0 |
| 2015 | $1,017 | $82,240 | $0 | $0 |
| 2014 | $1,005 | $79,850 | $0 | $0 |
Source: Public Records
Map
Nearby Homes
- 330 SW K St
- 708 SW Bridge St
- 303 SW I St
- 139 SW I St
- 927 SW L St
- 1013 SW L St
- 205 SW Booth St
- 207 SW Oak St
- 253 SW Central Ave
- 1019 SW J St
- 1011 SW I St
- 11311133 SW Central Ave
- 702 SE 9th St
- 508 NW E St Unit A,B,C
- 409 SE J St
- 419 NW D St
- 1129 SW Ballinger Dr
- 415 SE J St
- 955 SW Rogue River Ave Unit A
- 419 NW C St