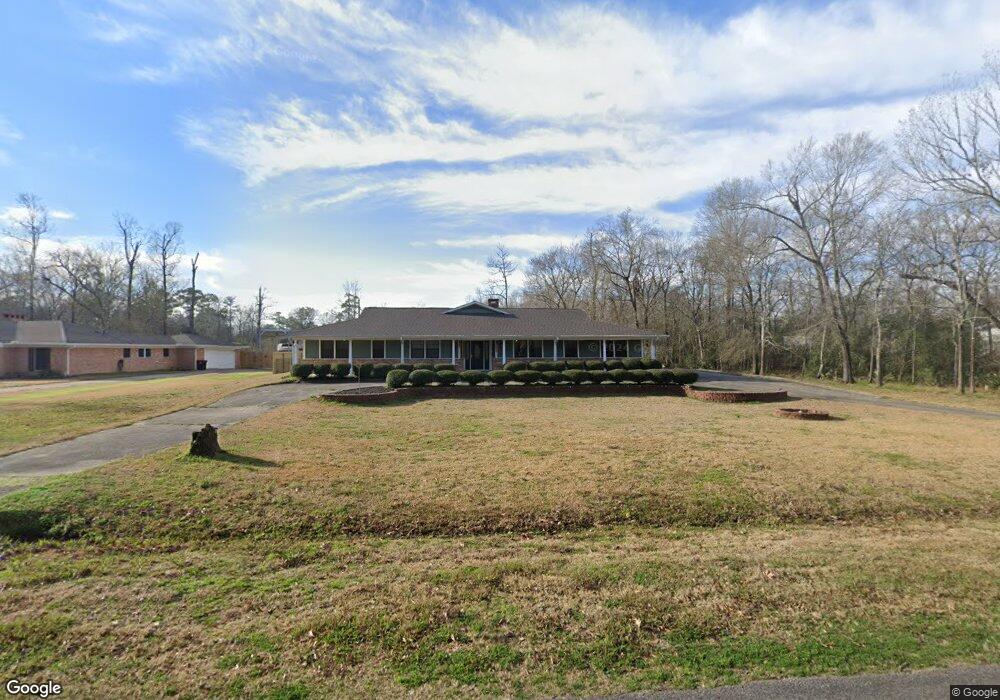
343 W Pineshadows Dr Unit 343 W Pine Shadows Sour Lake, TX 77659
Pinewood Estates NeighborhoodEstimated Value: $338,018 - $366,000
4
Beds
3
Baths
2,971
Sq Ft
$119/Sq Ft
Est. Value
About This Home
This home is located at 343 W Pineshadows Dr Unit 343 W Pine Shadows, Sour Lake, TX 77659 and is currently estimated at $352,255, approximately $118 per square foot. 343 W Pineshadows Dr Unit 343 W Pine Shadows is a home located in Hardin County with nearby schools including Hardin-Jefferson Junior High School and Hardin-Jefferson High School.
Ownership History
Date
Name
Owned For
Owner Type
Purchase Details
Closed on
Oct 2, 2022
Sold by
Cooper Danielle Devonne
Bought by
Cooper Danielle Devonne and Franco Gloria White
Current Estimated Value
Home Financials for this Owner
Home Financials are based on the most recent Mortgage that was taken out on this home.
Original Mortgage
$287,804
Outstanding Balance
$276,914
Interest Rate
6.02%
Mortgage Type
FHA
Estimated Equity
$75,341
Purchase Details
Closed on
Jun 25, 2021
Sold by
Ak Complete Services Llc
Bought by
Cooper Danielle Devonne
Home Financials for this Owner
Home Financials are based on the most recent Mortgage that was taken out on this home.
Original Mortgage
$260,988
Interest Rate
2.9%
Mortgage Type
FHA
Purchase Details
Closed on
Jun 15, 2021
Sold by
Ak Complete Servicees Llc
Bought by
Cooper Danielle Devonne and Stuckman Victoria
Home Financials for this Owner
Home Financials are based on the most recent Mortgage that was taken out on this home.
Original Mortgage
$260,988
Interest Rate
2.9%
Mortgage Type
FHA
Create a Home Valuation Report for This Property
The Home Valuation Report is an in-depth analysis detailing your home's value as well as a comparison with similar homes in the area
Home Values in the Area
Average Home Value in this Area
Purchase History
| Date | Buyer | Sale Price | Title Company |
|---|---|---|---|
| Cooper Danielle Devonne | -- | -- | |
| Cooper Danielle Devonne | -- | None Available | |
| Cooper Danielle Devonne | -- | Capital Title |
Source: Public Records
Mortgage History
| Date | Status | Borrower | Loan Amount |
|---|---|---|---|
| Open | Cooper Danielle Devonne | $287,804 | |
| Previous Owner | Cooper Danielle Devonne | $260,988 |
Source: Public Records
Tax History Compared to Growth
Tax History
| Year | Tax Paid | Tax Assessment Tax Assessment Total Assessment is a certain percentage of the fair market value that is determined by local assessors to be the total taxable value of land and additions on the property. | Land | Improvement |
|---|---|---|---|---|
| 2024 | $3,317 | $178,879 | $31,745 | $243,210 |
| 2023 | $1,684 | $162,617 | $31,745 | $251,896 |
| 2022 | $3,156 | $147,834 | $11,753 | $136,081 |
| 2021 | $6,720 | $295,400 | $23,510 | $271,890 |
| 2020 | $4,907 | $215,720 | $22,280 | $193,440 |
| 2019 | $610 | $19,020 | $18,980 | $40 |
| 2018 | $326 | $19,020 | $18,980 | $40 |
| 2017 | $5,589 | $217,730 | $18,980 | $198,750 |
| 2016 | $5,589 | $217,730 | $18,980 | $198,750 |
| 2015 | $4,313 | $188,420 | $9,500 | $178,920 |
| 2014 | $4,002 | $188,420 | $9,500 | $178,920 |
Source: Public Records
Map
Nearby Homes
- 315 Pinehurst Dr
- 1014 Pine Needles Dr
- 418 Pinemont Dr
- 310 Pinemont Dr
- 475 Piney Point Dr
- 1008 Pinewood Blvd
- 000 Pine Cone Ln
- 18 Pinewood Blvd
- Lot 13 Lakeview Dr
- Lot 12 Lakeview Dr
- 430 Bonura Rd N
- 135 Woodlawn Dr
- 000 Pinewood Blvd
- 120 Bevan Cir
- 503 Country Wood Cir
- 154 Wood Manor Ln
- 17089 Hwy 105
- 15815 Texas 105
- 18053 Texas 105
- 18053 Highway 105
- 343 W Pineshadows Dr
- 339 W Pineshadows Dr
- 351 W Pineshadows Dr
- 0 W Pineshadows Dr Unit 67374
- 0 W Pineshadows Dr Unit 80409208
- 0 W Pineshadows Dr Unit 51474932
- 447 W Pineshadows Dr
- 0000 W Pineshadows Dr
- 445 W Pineshadows Dr
- 0 W Pineshadows Dr Unit 223720
- 0 W Pineshadows Dr Unit 223718
- 0 W Pineshadows Dr Unit 166574
- 00 W Pineshadows Dr
- 000 W Pineshadows Dr
- 318 W Pineshadows Dr
- 0 W Pineshadows Dr Unit 207992
- 346 Pinehurst Dr
- 335 W Pineshadows Dr
- 334 W Pineshadows Dr
- 342 Pinehurst Dr