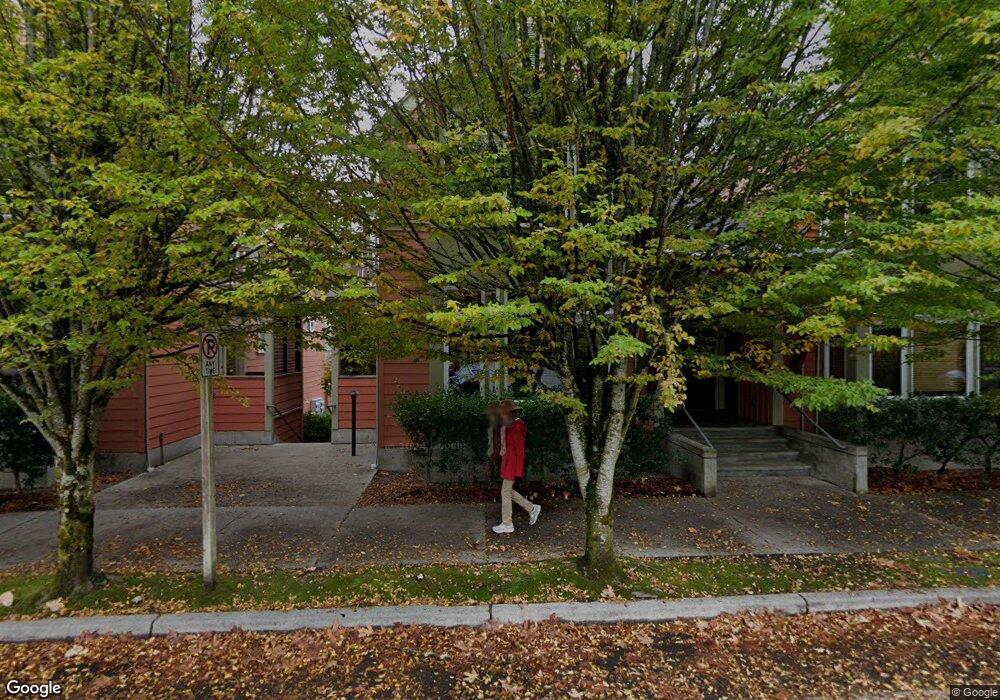
343 Winslow Way W Unit 202 Bainbridge Island, WA 98110
Estimated Value: $513,318 - $674,000
2
Beds
1
Bath
887
Sq Ft
$684/Sq Ft
Est. Value
About This Home
This home is located at 343 Winslow Way W Unit 202, Bainbridge Island, WA 98110 and is currently estimated at $606,330, approximately $683 per square foot. 343 Winslow Way W Unit 202 is a home located in Kitsap County with nearby schools including Bainbridge High School, Madrona School, and St. Cecilia Catholic School.
Ownership History
Date
Name
Owned For
Owner Type
Purchase Details
Closed on
Sep 18, 2025
Sold by
Simons Robin
Bought by
Van Gelder-Simons Living Trust and Van Gelder
Current Estimated Value
Purchase Details
Closed on
Jun 8, 2011
Sold by
Holmes Bryce E and Larsen Holmes Sherry S
Bought by
Simons Robin
Home Financials for this Owner
Home Financials are based on the most recent Mortgage that was taken out on this home.
Original Mortgage
$100,000
Interest Rate
4.55%
Mortgage Type
New Conventional
Purchase Details
Closed on
Aug 8, 2005
Sold by
Hargadine Samuel E and Hargadine Regina M
Bought by
Holmes Bryce E and Larsen Holmes Sherry S
Purchase Details
Closed on
Jan 23, 2004
Sold by
Corner House Llc
Bought by
Hargadine Samuel E and Hargadine Regina M
Home Financials for this Owner
Home Financials are based on the most recent Mortgage that was taken out on this home.
Original Mortgage
$188,000
Interest Rate
5.79%
Mortgage Type
Unknown
Create a Home Valuation Report for This Property
The Home Valuation Report is an in-depth analysis detailing your home's value as well as a comparison with similar homes in the area
Home Values in the Area
Average Home Value in this Area
Purchase History
| Date | Buyer | Sale Price | Title Company |
|---|---|---|---|
| Van Gelder-Simons Living Trust | $313 | None Listed On Document | |
| Simons Robin | $247,780 | Pacific Nw Title | |
| Holmes Bryce E | $335,280 | Pacific Nw Title | |
| Hargadine Samuel E | $235,000 | Pacific Nw Title |
Source: Public Records
Mortgage History
| Date | Status | Borrower | Loan Amount |
|---|---|---|---|
| Previous Owner | Simons Robin | $100,000 | |
| Previous Owner | Hargadine Samuel E | $188,000 |
Source: Public Records
Tax History Compared to Growth
Tax History
| Year | Tax Paid | Tax Assessment Tax Assessment Total Assessment is a certain percentage of the fair market value that is determined by local assessors to be the total taxable value of land and additions on the property. | Land | Improvement |
|---|---|---|---|---|
| 2026 | $4,196 | $501,460 | -- | $501,460 |
| 2025 | $4,196 | $501,460 | -- | $501,460 |
| 2024 | $4,011 | $501,460 | -- | $501,460 |
| 2023 | $4,175 | $501,460 | $0 | $501,460 |
| 2022 | $4,238 | $436,050 | $0 | $436,050 |
| 2021 | $4,043 | $396,410 | $0 | $396,410 |
| 2020 | $3,742 | $360,370 | $0 | $360,370 |
| 2019 | $3,501 | $343,210 | $0 | $343,210 |
| 2018 | $3,718 | $297,150 | $0 | $297,150 |
| 2017 | $3,192 | $297,150 | $0 | $297,150 |
| 2016 | $3,016 | $267,210 | $0 | $267,210 |
| 2015 | $2,701 | $242,920 | $0 | $242,920 |
| 2014 | -- | $231,350 | $0 | $231,350 |
| 2013 | -- | $231,350 | $0 | $231,350 |
Source: Public Records
Map
Nearby Homes
- 144 Hall Brothers Loop NW Unit 101
- 259 Shepard Way NW Unit 204
- 214 Shepard Way NW
- 204 Shepard Way NW
- 230 Canopy Path NW
- 200 Shepard Way NW
- 224 Canopy Path NW
- 141 Parfitt Way SW Unit A-35
- 141 Parfitt Way SW Unit M-10
- 392 Wills Ln NW
- 522 Madrona Way NE Unit 4
- 465 Winslow Way E Unit 108
- 774 Madison Ave N Unit B774
- 171 Wallace Way NE Unit B
- 752 NE Vineyard Ln Unit L205
- 620 NE Vineyard Ln Unit B302
- 610 NE Vineyard Ln Unit A104
- 9986 NE Ewing St
- 8277 New Holland Ct NE
- 1240 Weaver Rd NW Unit B1
- 343 Winslow Way W
- 343 Winslow Way W Unit 203
- 343 Winslow Way W Unit 103
- 343 Winslow Way W Unit 102
- 325 Winslow Way W Unit 201
- 325 Winslow Way W Unit 200
- 325 Winslow Way W Unit 101
- 120 Wood Ave SW
- 132 Wood Ave SW Unit 202
- 156 Wood Ave SW Unit 4
- 111 Wood Ave SW
- 342 Winslow Way W Unit 3
- 342 Winslow Way W Unit 2
- 342 Winslow Way W Unit 1
- 121 Wood Ave SW Unit a & b
- 121 Wood Ave SW
- 253 Winslow Way W Unit 103
- 253 Winslow Way W Unit 102
- 253 Winslow Way W Unit 302
- 253 Winslow Way W Unit 301