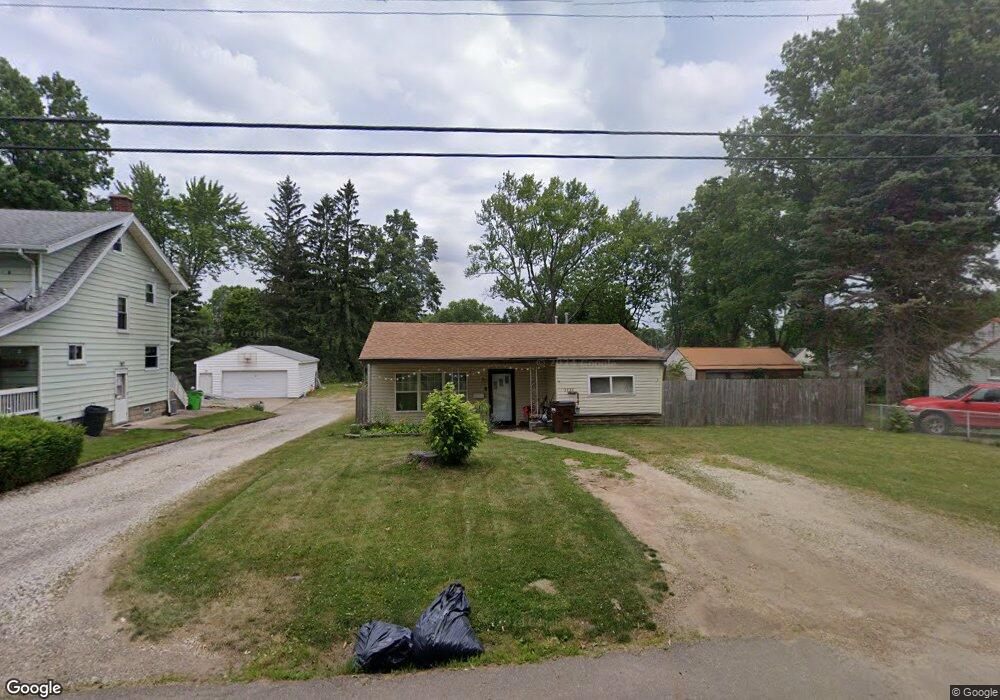
3430 Dalecrest St NW Massillon, OH 44646
Estimated Value: $116,000 - $172,000
2
Beds
1
Bath
980
Sq Ft
$146/Sq Ft
Est. Value
About This Home
This home is located at 3430 Dalecrest St NW, Massillon, OH 44646 and is currently estimated at $142,593, approximately $145 per square foot. 3430 Dalecrest St NW is a home located in Stark County with nearby schools including Edison Middle School, Pfeiffer Intermediate School, and Perry High School.
Ownership History
Date
Name
Owned For
Owner Type
Purchase Details
Closed on
Jun 29, 2011
Sold by
Bac Home Loans Servicing Lp
Bought by
Nauer Douglas J and Nauer Phyllis D
Current Estimated Value
Purchase Details
Closed on
Dec 13, 2010
Sold by
Fannie Mae
Bought by
Bac Home Loans Servicing Lp and Countrywide Home Loans Servicing Lp
Purchase Details
Closed on
Sep 30, 2010
Sold by
Hopple Matt
Bought by
Federal National Mortgage Association
Purchase Details
Closed on
Aug 22, 2002
Sold by
Snyder Rebecca M
Bought by
Hopple Matt
Home Financials for this Owner
Home Financials are based on the most recent Mortgage that was taken out on this home.
Original Mortgage
$52,000
Interest Rate
6.63%
Mortgage Type
Purchase Money Mortgage
Create a Home Valuation Report for This Property
The Home Valuation Report is an in-depth analysis detailing your home's value as well as a comparison with similar homes in the area
Home Values in the Area
Average Home Value in this Area
Purchase History
| Date | Buyer | Sale Price | Title Company |
|---|---|---|---|
| Nauer Douglas J | $19,100 | None Available | |
| Bac Home Loans Servicing Lp | $34,000 | Attorney | |
| Federal National Mortgage Association | $34,000 | None Available | |
| Hopple Matt | $65,000 | -- |
Source: Public Records
Mortgage History
| Date | Status | Borrower | Loan Amount |
|---|---|---|---|
| Previous Owner | Hopple Matt | $52,000 |
Source: Public Records
Tax History Compared to Growth
Tax History
| Year | Tax Paid | Tax Assessment Tax Assessment Total Assessment is a certain percentage of the fair market value that is determined by local assessors to be the total taxable value of land and additions on the property. | Land | Improvement |
|---|---|---|---|---|
| 2025 | -- | $28,180 | $9,420 | $18,760 |
| 2024 | -- | $28,180 | $9,420 | $18,760 |
| 2023 | $1,155 | $22,540 | $7,560 | $14,980 |
| 2022 | $579 | $22,540 | $7,560 | $14,980 |
| 2021 | $1,233 | $22,540 | $7,560 | $14,980 |
| 2020 | $1,078 | $18,900 | $6,370 | $12,530 |
| 2019 | $975 | $18,910 | $6,370 | $12,540 |
| 2018 | $970 | $18,910 | $6,370 | $12,540 |
| 2017 | $642 | $11,560 | $5,250 | $6,310 |
| 2016 | $646 | $11,560 | $5,250 | $6,310 |
| 2015 | $651 | $11,560 | $5,250 | $6,310 |
| 2014 | $672 | $11,740 | $5,360 | $6,380 |
| 2013 | $323 | $11,740 | $5,360 | $6,380 |
Source: Public Records
Map
Nearby Homes
- 141 Ingall Ave NW
- 3412 Bailey St NW
- 212 Lennox Ave NW
- 0 Newport Ave NW Unit 5143464
- 232 Proudley Ave SW
- 226 Austin Ave NW
- 138 Wrexham Ave SW
- 337 Harding Ave NW
- 420 Snively Ave NW
- 334 Locke Ave NW
- 326 Locke Ave NW
- 3103 Wattova Rd NW
- 200 Stewart Ave NW
- 122 Westland Ave SW
- 212 Westland Ave SW
- 3626 Hazelbrook St SW
- 804 Jeffrey Ave NW
- 302 Jackson Ave NW
- 1039 Prescot Ave NW
- 518 Jackson Ave NW
- 3426 Dalecrest St NW
- 3440 Dalecrest St NW
- 228 Freeman Ave NW
- 3427 Bailey St NW
- 300 Freeman Ave NW
- 300 Freeman Ave NW
- 3408 Dalecrest St NW
- 3433 Bailey St NW
- 225 Ingall Ave NW
- 229 Ingall Ave NW
- 3437 Bailey St NW
- 223 Ingall Ave NW
- 3417 Bailey St NW
- 3417 Bailey St NW
- 303 Ingall Ave NW
- 307 Ingall Ave NW
- 211 Ingall Ave NW
- 0 Freeman Ave NW
- 313 Ingall Ave NW
- 318 Freeman Ave NW