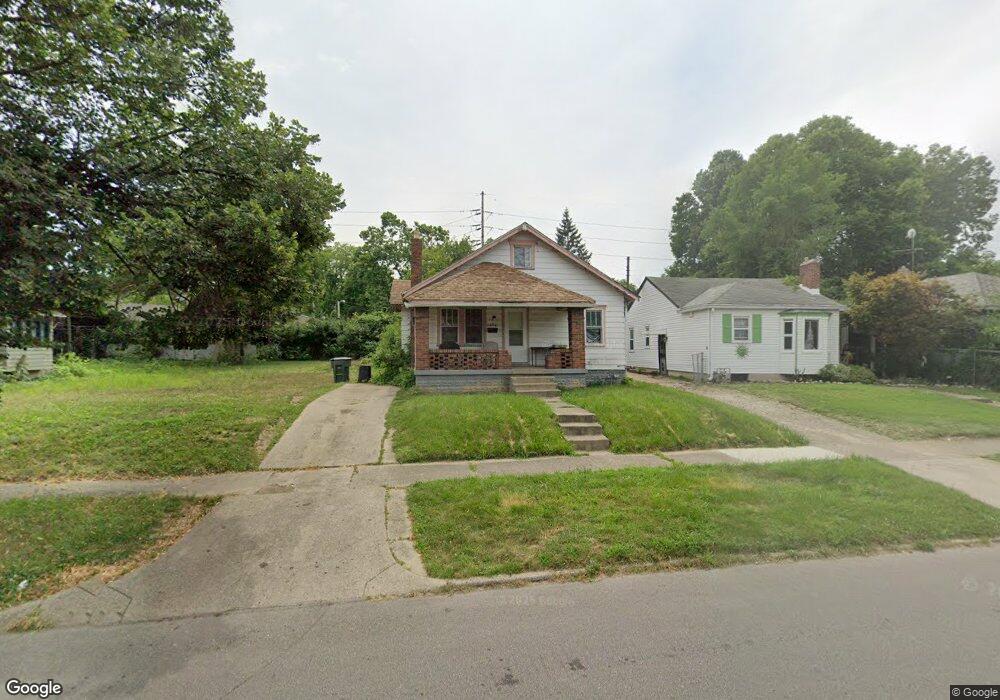
3432 Delphos Ave Dayton, OH 45417
Westwood NeighborhoodEstimated Value: $53,000 - $88,000
2
Beds
1
Bath
1,065
Sq Ft
$60/Sq Ft
Est. Value
About This Home
This home is located at 3432 Delphos Ave, Dayton, OH 45417 and is currently estimated at $64,303, approximately $60 per square foot. 3432 Delphos Ave is a home located in Montgomery County with nearby schools including International School at Residence Park, Westwood Elementary, and Louise Troy Elementary.
Ownership History
Date
Name
Owned For
Owner Type
Purchase Details
Closed on
May 11, 2015
Sold by
Wiggins Jewell and Wiggins Brenda
Bought by
Lanier Randy
Current Estimated Value
Purchase Details
Closed on
Aug 27, 2010
Sold by
Carter Joel L and Carter Carlee A
Bought by
Wiggins Jewell and Wiggins Brenda
Purchase Details
Closed on
Nov 17, 2003
Sold by
Citifinancial Mortgage Co Inc
Bought by
Carter Joel L and Carter Carlee A
Purchase Details
Closed on
Jun 6, 2003
Sold by
Frost Robert L
Bought by
Citifinancial Mortgage Co Inc
Purchase Details
Closed on
Dec 21, 1999
Sold by
Bold Enterprises Inc
Bought by
Frost Robert L
Home Financials for this Owner
Home Financials are based on the most recent Mortgage that was taken out on this home.
Original Mortgage
$37,060
Interest Rate
7.69%
Purchase Details
Closed on
Nov 16, 1995
Sold by
Balazs Georgia A
Bought by
Bold Enterprises Inc
Create a Home Valuation Report for This Property
The Home Valuation Report is an in-depth analysis detailing your home's value as well as a comparison with similar homes in the area
Home Values in the Area
Average Home Value in this Area
Purchase History
| Date | Buyer | Sale Price | Title Company |
|---|---|---|---|
| Lanier Randy | $1,000 | Attorney | |
| Wiggins Jewell | $10,000 | None Available | |
| Carter Joel L | $9,500 | -- | |
| Citifinancial Mortgage Co Inc | $20,000 | -- | |
| Frost Robert L | $43,000 | First Title Ins Agency Inc | |
| Bold Enterprises Inc | -- | -- |
Source: Public Records
Mortgage History
| Date | Status | Borrower | Loan Amount |
|---|---|---|---|
| Previous Owner | Frost Robert L | $37,060 |
Source: Public Records
Tax History Compared to Growth
Tax History
| Year | Tax Paid | Tax Assessment Tax Assessment Total Assessment is a certain percentage of the fair market value that is determined by local assessors to be the total taxable value of land and additions on the property. | Land | Improvement |
|---|---|---|---|---|
| 2024 | $208 | $3,630 | $2,310 | $1,320 |
| 2023 | $208 | $3,630 | $2,310 | $1,320 |
| 2022 | $219 | $2,950 | $1,880 | $1,070 |
| 2021 | $217 | $2,950 | $1,880 | $1,070 |
| 2020 | $292 | $2,950 | $1,880 | $1,070 |
| 2019 | $314 | $2,790 | $1,880 | $910 |
| 2018 | $333 | $2,790 | $1,880 | $910 |
| 2017 | $332 | $2,790 | $1,880 | $910 |
| 2016 | $349 | $2,870 | $1,880 | $990 |
| 2015 | $820 | $2,870 | $1,880 | $990 |
| 2014 | $820 | $2,870 | $1,880 | $990 |
| 2012 | -- | $11,060 | $3,050 | $8,010 |
Source: Public Records
Map
Nearby Homes
- 314 N Upland Ave Unit 312
- 222 N Decker Ave
- 309 Leland Ave
- 227 Walton Ave
- 79 N Alder St
- 71 N Alder St
- 524 Crestmore Ave
- 432 N Gettysburg Ave
- 320 Huron Ave
- 532 Crestmore Ave
- 712 N Gettysburg Ave
- 605 N Gettysburg Ave
- 221 Brooklyn Ave
- 45 S Trenton St
- 19 S Alder St Unit 21
- 308 Brooklyn Ave
- 2905 W Third St
- 4126 Sylvan Dr
- 911 N Gettysburg Ave
- 3602 Hoover Ave Unit 3600
- 3434 Delphos Ave
- 3428 Delphos Ave
- 3438 Delphos Ave
- 3444 Delphos Ave
- 3424 Delphos Ave
- 3429 W 2nd St
- 3502 Delphos Ave
- 3427 Delphos Ave
- 3506 Delphos Ave
- 3443 W 2nd St
- 300 N Upland Ave
- 215 Burleigh Ave
- 202 N Decker Ave
- 207 Burleigh Ave
- 3510 Delphos Ave
- 304 N Upland Ave
- 217 Burleigh Ave
- 208 N Decker Ave
- 221 Burleigh Ave
- 308 N Upland Ave