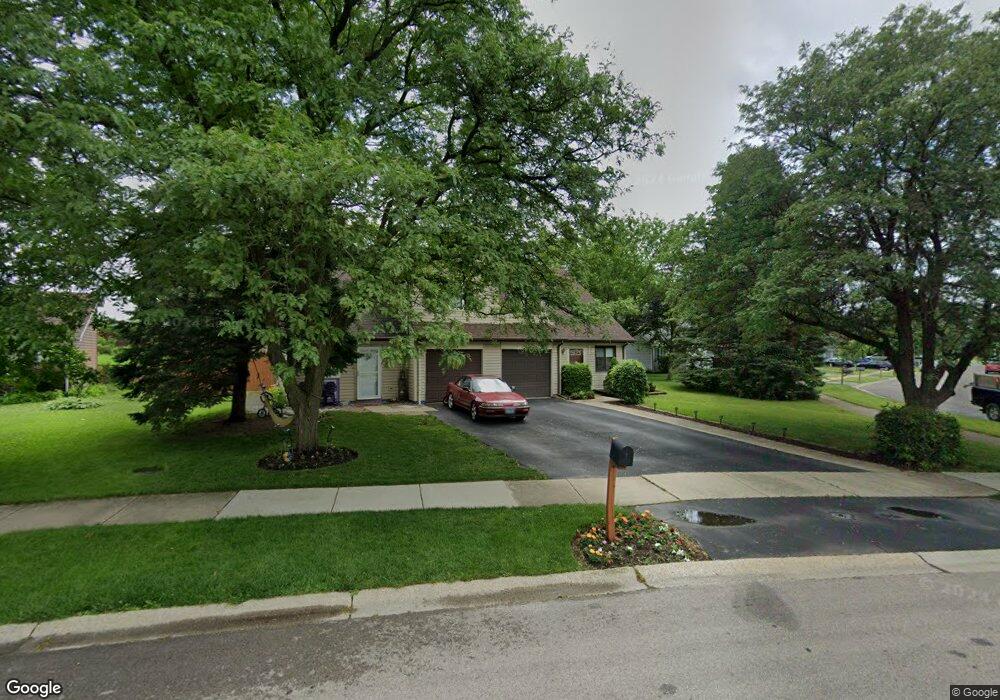
3432 Fox Hill Rd Unit 17C Aurora, IL 60504
South East Village NeighborhoodEstimated Value: $215,000 - $258,105
3
Beds
1
Bath
1,138
Sq Ft
$207/Sq Ft
Est. Value
About This Home
This home is located at 3432 Fox Hill Rd Unit 17C, Aurora, IL 60504 and is currently estimated at $235,776, approximately $207 per square foot. 3432 Fox Hill Rd Unit 17C is a home located in DuPage County with nearby schools including Georgetown Elementary School, Mill Street Elementary School, and Fischer Middle School.
Ownership History
Date
Name
Owned For
Owner Type
Purchase Details
Closed on
Oct 31, 2000
Sold by
Chapman Jeffrey D
Bought by
Bollendorf Gregory J and Bollendorf Erica
Current Estimated Value
Home Financials for this Owner
Home Financials are based on the most recent Mortgage that was taken out on this home.
Original Mortgage
$100,700
Outstanding Balance
$37,079
Interest Rate
7.87%
Mortgage Type
Purchase Money Mortgage
Estimated Equity
$198,697
Purchase Details
Closed on
May 15, 1997
Sold by
Wegman Scott W and Wegman Dawn L
Bought by
Chapman Jeffrey D
Home Financials for this Owner
Home Financials are based on the most recent Mortgage that was taken out on this home.
Original Mortgage
$90,928
Interest Rate
8.24%
Mortgage Type
FHA
Purchase Details
Closed on
Oct 28, 1994
Sold by
Noble Bryan C and Noble Rebecca F
Bought by
Wegman Scott W and Wegman Dawn L
Home Financials for this Owner
Home Financials are based on the most recent Mortgage that was taken out on this home.
Original Mortgage
$66,500
Interest Rate
7.25%
Mortgage Type
Purchase Money Mortgage
Create a Home Valuation Report for This Property
The Home Valuation Report is an in-depth analysis detailing your home's value as well as a comparison with similar homes in the area
Home Values in the Area
Average Home Value in this Area
Purchase History
| Date | Buyer | Sale Price | Title Company |
|---|---|---|---|
| Bollendorf Gregory J | $106,000 | -- | |
| Chapman Jeffrey D | $92,500 | -- | |
| Wegman Scott W | $86,500 | -- |
Source: Public Records
Mortgage History
| Date | Status | Borrower | Loan Amount |
|---|---|---|---|
| Open | Bollendorf Gregory J | $100,700 | |
| Previous Owner | Chapman Jeffrey D | $90,928 | |
| Previous Owner | Wegman Scott W | $66,500 |
Source: Public Records
Tax History Compared to Growth
Tax History
| Year | Tax Paid | Tax Assessment Tax Assessment Total Assessment is a certain percentage of the fair market value that is determined by local assessors to be the total taxable value of land and additions on the property. | Land | Improvement |
|---|---|---|---|---|
| 2024 | $4,117 | $62,144 | $21,256 | $40,888 |
| 2023 | $3,888 | $55,840 | $19,100 | $36,740 |
| 2022 | $3,663 | $49,680 | $16,870 | $32,810 |
| 2021 | $3,555 | $47,910 | $16,270 | $31,640 |
| 2020 | $3,599 | $47,910 | $16,270 | $31,640 |
| 2019 | $3,456 | $45,560 | $15,470 | $30,090 |
| 2018 | $2,164 | $30,500 | $10,330 | $20,170 |
| 2017 | $1,952 | $27,670 | $9,370 | $18,300 |
| 2016 | $1,761 | $25,050 | $8,480 | $16,570 |
| 2015 | $1,720 | $23,780 | $8,050 | $15,730 |
| 2014 | $1,651 | $22,570 | $7,580 | $14,990 |
| 2013 | $1,637 | $22,720 | $7,630 | $15,090 |
Source: Public Records
Map
Nearby Homes
- 3467 Charlemaine Dr
- 3473 Ravinia Cir
- 3479 Charlemaine Dr
- 3437 Charlemaine Dr
- 3140 Medford Ct
- 2950 Shelly Ln Unit 2950
- 2901 Shelly Ln
- 1334 Normantown Rd Unit 334
- 2750 Shelly Ln
- 441 Park Ridge Ln Unit C
- 1335 Lawrence Ct
- 2860 Bridgeport Ln Unit 19D
- 1465 Bridgeport Ln Unit 19D
- 573 Watercress Dr
- 3290 Johnsbury Ct
- 1348 Amaranth Dr
- 3131 Portland Ct
- 164 Park Ridge Ln
- 300 Churchill Ln
- 3132 Portland Ct
- 3430 Fox Hill Rd Unit 17C
- 3422 Fox Hill Rd Unit 17C
- 1101 Pheasant Run Ln
- 3420 Fox Hill Rd
- 1099 Pheasant Run Ln
- 1097 Pheasant Run Ln Unit 18C
- 1095 Pheasant Run Ln Unit 18C
- 3412 Fox Hill Rd
- 3417 Fox Hill Rd Unit 17C
- 1098 Pheasant Run Ln Unit 18C
- 3415 Fox Hill Rd
- 3410 Fox Hill Rd Unit 17C
- 3425 Fox Hill Rd Unit 17C
- 1093 Pheasant Run Ln Unit 18C
- 1092 Pheasant Run Ln
- 3407 Fox Hill Rd
- 3427 Fox Hill Rd Unit 17C
- 1091 Pheasant Run Ln
- 1091 Pheasant Run Ln
- 3405 Fox Hill Rd