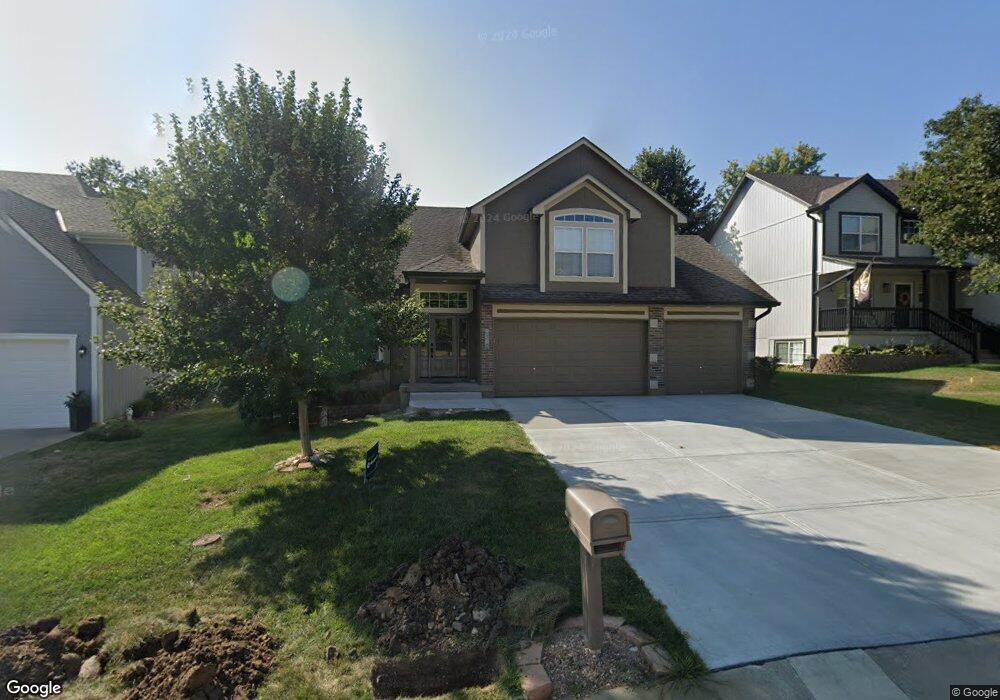
3432 NW Chapman Ct Blue Springs, MO 64015
Estimated Value: $383,291 - $425,000
3
Beds
3
Baths
1,947
Sq Ft
$208/Sq Ft
Est. Value
About This Home
This home is located at 3432 NW Chapman Ct, Blue Springs, MO 64015 and is currently estimated at $404,073, approximately $207 per square foot. 3432 NW Chapman Ct is a home located in Jackson County with nearby schools including James Lewis Elementary School, Brittany Hill Middle School, and Blue Springs High School.
Ownership History
Date
Name
Owned For
Owner Type
Purchase Details
Closed on
Dec 17, 2010
Sold by
Federal Home Loan Mortgage Corporation
Bought by
Sellars Roger D and Sellars Sherry S
Current Estimated Value
Home Financials for this Owner
Home Financials are based on the most recent Mortgage that was taken out on this home.
Original Mortgage
$161,690
Interest Rate
4.24%
Mortgage Type
FHA
Purchase Details
Closed on
Aug 2, 2010
Sold by
Hutchens Thomas D and Hutchens Shanna
Bought by
Federal Home Loan Mortgage Corp
Purchase Details
Closed on
Aug 10, 2007
Sold by
Kansas City Regional Builders Llc
Bought by
Hutchens Thomas D and Hutchens Shanna
Home Financials for this Owner
Home Financials are based on the most recent Mortgage that was taken out on this home.
Original Mortgage
$218,955
Interest Rate
6.64%
Mortgage Type
Purchase Money Mortgage
Purchase Details
Closed on
Mar 12, 2007
Sold by
Dave Richards Home Building Inc
Bought by
Kansas City Regional Builders Llc
Home Financials for this Owner
Home Financials are based on the most recent Mortgage that was taken out on this home.
Original Mortgage
$183,920
Interest Rate
6.32%
Mortgage Type
Construction
Create a Home Valuation Report for This Property
The Home Valuation Report is an in-depth analysis detailing your home's value as well as a comparison with similar homes in the area
Home Values in the Area
Average Home Value in this Area
Purchase History
| Date | Buyer | Sale Price | Title Company |
|---|---|---|---|
| Sellars Roger D | -- | Continental Title | |
| Federal Home Loan Mortgage Corp | $195,000 | None Available | |
| Hutchens Thomas D | -- | Metro One Title | |
| Kansas City Regional Builders Llc | -- | Metro One Title |
Source: Public Records
Mortgage History
| Date | Status | Borrower | Loan Amount |
|---|---|---|---|
| Previous Owner | Sellars Roger D | $161,690 | |
| Previous Owner | Hutchens Thomas D | $218,955 | |
| Previous Owner | Kansas City Regional Builders Llc | $183,920 |
Source: Public Records
Tax History Compared to Growth
Tax History
| Year | Tax Paid | Tax Assessment Tax Assessment Total Assessment is a certain percentage of the fair market value that is determined by local assessors to be the total taxable value of land and additions on the property. | Land | Improvement |
|---|---|---|---|---|
| 2025 | $4,731 | $61,813 | $7,697 | $54,116 |
| 2024 | $5,245 | $57,988 | $4,788 | $53,200 |
| 2023 | $5,245 | $65,550 | $9,449 | $56,101 |
| 2022 | $4,232 | $46,740 | $4,456 | $42,284 |
| 2021 | $4,228 | $46,740 | $4,456 | $42,284 |
| 2020 | $3,889 | $43,736 | $4,456 | $39,280 |
| 2019 | $3,760 | $43,736 | $4,456 | $39,280 |
| 2018 | $3,771 | $42,225 | $6,227 | $35,998 |
| 2017 | $3,771 | $42,225 | $6,227 | $35,998 |
| 2016 | $3,698 | $41,515 | $7,315 | $34,200 |
| 2014 | $3,512 | $39,292 | $6,840 | $32,452 |
Source: Public Records
Map
Nearby Homes
- 3501 NW Nautical Ct
- 4013 NW Sol Dr
- 3605 NW Pier Ct
- 2433 NW Sunnyvale Ct
- 2437 NW Sunnyvale Ct
- 2413 NW Sunnyvale Ct
- 4043 NW Eclipse Place
- 22908 E 41st Terrace S
- The Kinley Plan at Sunny Pointe - Sunny Pointe Villas
- The Wynn Plan at Sunny Pointe - Sunny Pointe Villas
- 1618 NW Samantha Ct
- 22513 E 43rd St Ct S
- 3404 Thornbird St
- 3413 S Victoria Dr
- 1604 NW Sunridge Dr
- 3209 S Thornbird Ave
- 22513 E 33rd Street Ct S
- 1701 NW Duncan Rd
- 22812 E Bradford Lane Ct
- 3224 S Cardinal Ct
- 3436 NW Chapman Ct
- 3428 NW Chapman Ct
- 3413 NW Nautical Ct
- 3502 NW Chapman Ct
- 3506 NW Chapman Ct
- 3409 NW Nautical Ct
- 3420 NW Chapman Ct
- 3421 NW Chapman Ct
- 3417 NW Chapman Ct
- 3503 NW Chapman Ct
- 3405 NW Nautical Ct
- 3416 NW Chapman Ct
- 3413 NW Chapman Ct
- 3510 NW Chapman Ct
- 2404 NW Windburn Dr
- 3509 NW Nautical Ct
- 3412 NW Chapman Ct
- 3507 NW Chapman Ct
- 3409 NW Chapman Ct
- 3401 NW Nautical Ct