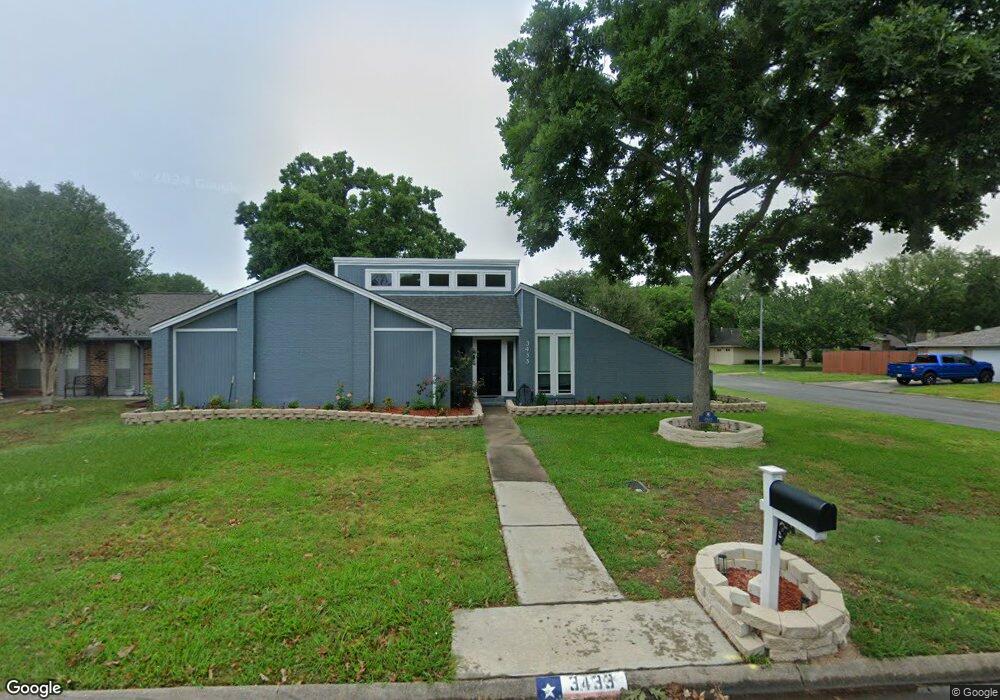
3433 Avenue R Rosenberg, TX 77471
Estimated Value: $233,000 - $274,000
3
Beds
2
Baths
1,798
Sq Ft
$144/Sq Ft
Est. Value
About This Home
This home is located at 3433 Avenue R, Rosenberg, TX 77471 and is currently estimated at $258,441, approximately $143 per square foot. 3433 Avenue R is a home located in Fort Bend County with nearby schools including Taylor Ray Elementary School, Navarro Middle School, and George Junior High School.
Ownership History
Date
Name
Owned For
Owner Type
Purchase Details
Closed on
Nov 30, 2010
Sold by
Rosetti Joseph F
Bought by
Rosetti Susan Coleman
Current Estimated Value
Purchase Details
Closed on
Apr 20, 2005
Sold by
Hull Jason Johnson and Hull Stacy
Bought by
Rosetti Joseph F and Rosetti Susan
Home Financials for this Owner
Home Financials are based on the most recent Mortgage that was taken out on this home.
Original Mortgage
$79,600
Interest Rate
5.89%
Mortgage Type
Purchase Money Mortgage
Purchase Details
Closed on
Dec 9, 1998
Sold by
Smith Joyce Elaine Hull and Hull Joyce Elaine
Bought by
Hull Jason Johnson
Home Financials for this Owner
Home Financials are based on the most recent Mortgage that was taken out on this home.
Original Mortgage
$40,000
Interest Rate
6.87%
Create a Home Valuation Report for This Property
The Home Valuation Report is an in-depth analysis detailing your home's value as well as a comparison with similar homes in the area
Home Values in the Area
Average Home Value in this Area
Purchase History
| Date | Buyer | Sale Price | Title Company |
|---|---|---|---|
| Rosetti Susan Coleman | -- | None Available | |
| Born Susan Coleman | -- | -- | |
| Rosetti Joseph F | -- | Startex Title Company | |
| Born Susan Coleman | -- | -- | |
| Hull Jason Johnson | -- | American Title Company |
Source: Public Records
Mortgage History
| Date | Status | Borrower | Loan Amount |
|---|---|---|---|
| Previous Owner | Born Susan Coleman | $79,600 | |
| Previous Owner | Hull Jason Johnson | $40,000 | |
| Closed | Born Susan Coleman | $0 |
Source: Public Records
Tax History Compared to Growth
Tax History
| Year | Tax Paid | Tax Assessment Tax Assessment Total Assessment is a certain percentage of the fair market value that is determined by local assessors to be the total taxable value of land and additions on the property. | Land | Improvement |
|---|---|---|---|---|
| 2025 | $3,245 | $232,888 | $31,958 | $200,930 |
| 2024 | $3,245 | $252,358 | $16,866 | $235,492 |
| 2023 | $2,921 | $229,416 | $0 | $238,290 |
| 2022 | $3,439 | $208,560 | $0 | $216,190 |
| 2021 | $3,934 | $189,600 | $31,960 | $157,640 |
| 2020 | $3,658 | $172,360 | $31,960 | $140,400 |
| 2019 | $3,579 | $156,690 | $31,960 | $124,730 |
| 2018 | $3,451 | $148,700 | $31,960 | $116,740 |
| 2017 | $3,155 | $135,180 | $31,960 | $103,220 |
| 2016 | $2,868 | $122,890 | $31,960 | $90,930 |
| 2015 | $2,407 | $123,550 | $31,960 | $91,590 |
| 2014 | $2,568 | $123,080 | $31,960 | $91,120 |
Source: Public Records
Map
Nearby Homes
- 3608 Avenue R
- 3433 Avenue P
- 3604 Rychlik Dr
- 3219 Creole Bay Ln
- 1926 Klauke Ct
- 2211 Hackberry Bank Ln
- 2002 Austin St
- 1803 Jones St
- 1711 Klauke St
- 1317 Tobola St
- 1633 Jones St
- 1300 Lawrence St
- 2126 Ripple Creek Dr
- 2717 Parrott Ave
- 1733 Brumbelow St
- 1215 Lawrence St
- 2705 Parrott Ave
- 0 Miles St
- 1921 Ripple Creek Dr
- 1119 Tobola St
- 3425 Avenue R
- 3421 Avenue R
- 3503 Avenue R
- 3432 Glenmeadow Dr
- 3424 Glenmeadow Dr
- 3417 Avenue R
- 3420 Glenmeadow Dr
- 3432 Avenue R
- 3424 Avenue R
- 3502 Glenmeadow Dr
- 3438 Avenue R
- 3509 Avenue R
- 3413 Avenue R
- 3412 Glenmeadow Dr
- 3416 Glenmeadow Dr
- 3420 Avenue R
- 3502 Avenue R
- 3416 Avenue R
- 3409 Avenue R
- 3508 Glenmeadow Dr