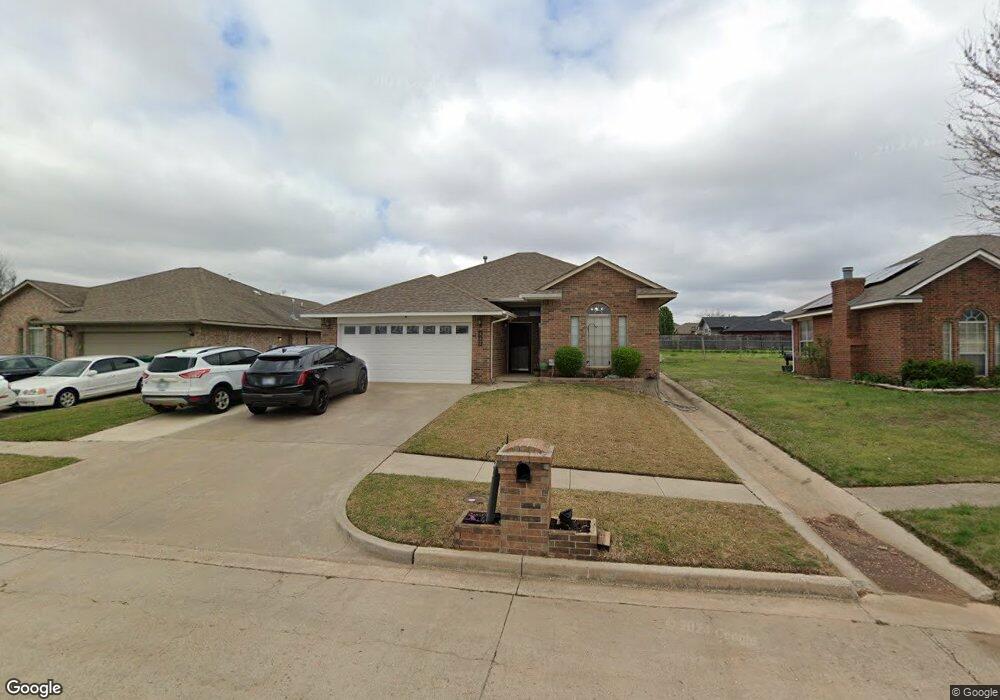
3433 Cobblestone Dr Spencer, OK 73084
Estimated Value: $178,996 - $195,000
3
Beds
2
Baths
1,481
Sq Ft
$125/Sq Ft
Est. Value
About This Home
This home is located at 3433 Cobblestone Dr, Spencer, OK 73084 and is currently estimated at $185,249, approximately $125 per square foot. 3433 Cobblestone Dr is a home located in Oklahoma County with nearby schools including Willow Brook Elementary School, Star Spencer Mid-High School, and Insight School of Oklahoma High School.
Ownership History
Date
Name
Owned For
Owner Type
Purchase Details
Closed on
Jun 20, 2014
Sold by
Rashidi Shani and Nealy Shani
Bought by
Nealy Marcus and Nealy Shani
Current Estimated Value
Purchase Details
Closed on
May 31, 2006
Sold by
Neal Mcgee Homes Inc
Bought by
Rashidi Shani
Home Financials for this Owner
Home Financials are based on the most recent Mortgage that was taken out on this home.
Original Mortgage
$101,583
Outstanding Balance
$59,756
Interest Rate
6.58%
Mortgage Type
FHA
Estimated Equity
$125,493
Purchase Details
Closed on
May 10, 2006
Sold by
Neal Mcgee Properties Llc
Bought by
Neal Mcgee Homes Inc
Home Financials for this Owner
Home Financials are based on the most recent Mortgage that was taken out on this home.
Original Mortgage
$101,583
Outstanding Balance
$59,756
Interest Rate
6.58%
Mortgage Type
FHA
Estimated Equity
$125,493
Create a Home Valuation Report for This Property
The Home Valuation Report is an in-depth analysis detailing your home's value as well as a comparison with similar homes in the area
Home Values in the Area
Average Home Value in this Area
Purchase History
| Date | Buyer | Sale Price | Title Company |
|---|---|---|---|
| Nealy Marcus | -- | None Available | |
| Rashidi Shani | $103,500 | Oklahoma City Abstract & Tit | |
| Neal Mcgee Homes Inc | -- | Oklahoma City Abstract & Tit |
Source: Public Records
Mortgage History
| Date | Status | Borrower | Loan Amount |
|---|---|---|---|
| Open | Rashidi Shani | $101,583 |
Source: Public Records
Tax History Compared to Growth
Tax History
| Year | Tax Paid | Tax Assessment Tax Assessment Total Assessment is a certain percentage of the fair market value that is determined by local assessors to be the total taxable value of land and additions on the property. | Land | Improvement |
|---|---|---|---|---|
| 2024 | $1,192 | $12,393 | $1,468 | $10,925 |
| 2023 | $1,192 | $12,032 | $1,549 | $10,483 |
| 2022 | $1,091 | $11,682 | $1,090 | $10,592 |
| 2021 | $1,065 | $11,342 | $1,513 | $9,829 |
| 2020 | $1,040 | $11,012 | $1,468 | $9,544 |
| 2019 | $1,004 | $10,691 | $1,486 | $9,205 |
| 2018 | $919 | $10,381 | $0 | $0 |
| 2017 | $890 | $10,077 | $1,396 | $8,681 |
| 2016 | $866 | $9,784 | $1,450 | $8,334 |
| 2015 | $840 | $9,498 | $1,524 | $7,974 |
| 2014 | $886 | $10,009 | $1,650 | $8,359 |
Source: Public Records
Map
Nearby Homes
- 3431 Cobblestone Dr
- 3435 Cobblestone Dr
- 8610 NE 34th St
- 8534 NE 34th Place
- 3427 Cobblestone Dr
- 3437 Cobblestone Dr
- 8611 NE 34th St
- 8530 NE 34th Place
- 8612 NE 34th Place
- 3438 Cobblestone Dr
- 8613 NE 34th St
- 8526 NE 34th Place
- 8616 NE 34th Place
- 3440 Cobblestone Dr
- 8606 NE 34th St
- 8615 NE 34th St
- 3441 Cobblestone Dr
- 8522 NE 34th Place
- 8608 NE 34th St
- 8618 NE 34th Place