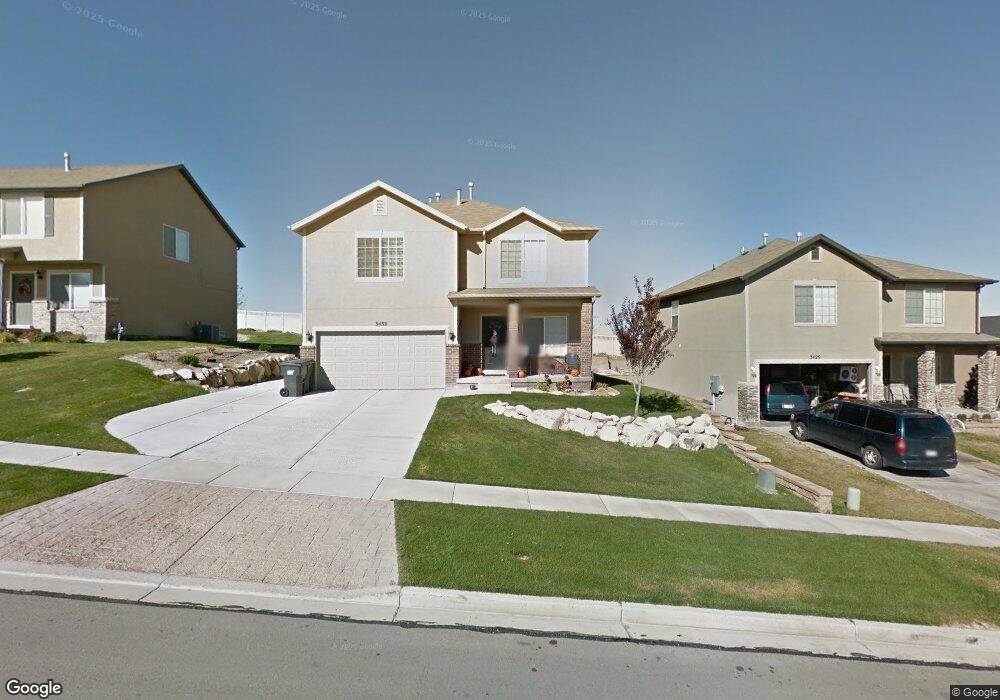
3433 S Red Tailed Crescent Saratoga Springs, UT 84045
Estimated Value: $491,000 - $537,000
3
Beds
3
Baths
2,047
Sq Ft
$253/Sq Ft
Est. Value
About This Home
This home is located at 3433 S Red Tailed Crescent, Saratoga Springs, UT 84045 and is currently estimated at $517,801, approximately $252 per square foot. 3433 S Red Tailed Crescent is a home located in Utah County with nearby schools including Lake Mountain Middle School and Westlake High School.
Ownership History
Date
Name
Owned For
Owner Type
Purchase Details
Closed on
May 22, 2023
Sold by
Francom Collin and Francom Brianna
Bought by
Francom
Current Estimated Value
Purchase Details
Closed on
Jun 16, 2020
Sold by
Richins Ryan and Richins Tosha P
Bought by
Francom Brianna and Francom Collin
Home Financials for this Owner
Home Financials are based on the most recent Mortgage that was taken out on this home.
Original Mortgage
$327,750
Interest Rate
3.2%
Mortgage Type
New Conventional
Purchase Details
Closed on
Nov 7, 2006
Sold by
Hawks Landing Homes Llc
Bought by
Richins Ryan and White Tosha P
Home Financials for this Owner
Home Financials are based on the most recent Mortgage that was taken out on this home.
Original Mortgage
$202,979
Interest Rate
6.3%
Mortgage Type
FHA
Create a Home Valuation Report for This Property
The Home Valuation Report is an in-depth analysis detailing your home's value as well as a comparison with similar homes in the area
Home Values in the Area
Average Home Value in this Area
Purchase History
| Date | Buyer | Sale Price | Title Company |
|---|---|---|---|
| Francom | -- | None Listed On Document | |
| Francom Brianna | -- | First Amer Union Heights Ctr | |
| Richins Ryan | -- | Inwest Title Services Inc |
Source: Public Records
Mortgage History
| Date | Status | Borrower | Loan Amount |
|---|---|---|---|
| Previous Owner | Francom Brianna | $327,750 | |
| Previous Owner | Richins Ryan | $202,979 |
Source: Public Records
Tax History Compared to Growth
Tax History
| Year | Tax Paid | Tax Assessment Tax Assessment Total Assessment is a certain percentage of the fair market value that is determined by local assessors to be the total taxable value of land and additions on the property. | Land | Improvement |
|---|---|---|---|---|
| 2025 | $1,939 | $457,200 | $185,300 | $271,900 |
| 2024 | $1,939 | $232,925 | $0 | $0 |
| 2023 | $1,848 | $238,755 | $0 | $0 |
| 2022 | $1,872 | $235,840 | $0 | $0 |
| 2021 | $1,638 | $307,900 | $110,700 | $197,200 |
| 2020 | $1,562 | $288,400 | $98,800 | $189,600 |
| 2019 | $1,473 | $281,600 | $92,000 | $189,600 |
| 2018 | $1,383 | $249,600 | $81,800 | $167,800 |
| 2017 | $1,350 | $130,350 | $0 | $0 |
| 2016 | $1,358 | $121,715 | $0 | $0 |
| 2015 | $1,291 | $109,780 | $0 | $0 |
| 2014 | $1,272 | $106,920 | $0 | $0 |
Source: Public Records
Map
Nearby Homes
- 291 W Kestrel Dr
- 273 W Autumn Creek Dr
- 367 W Autumn Creek Dr Unit 11216
- 3358 S Heathercrest Dr
- 3353 S Red Shouldered Trail
- 3352 S Heathercrest Dr Unit 11243
- 373 W Autumn Creek Dr
- 3338 S Heathercrest Dr Unit 11245
- Sweetwater Plan at Fox Hollow - Preserve
- Poppy Plan at Fox Hollow - Preserve
- Olympus Plan at Fox Hollow - Preserve
- Iris Plan at Fox Hollow - Preserve
- Aster Plan at Fox Hollow - Preserve
- Angelica Plan at Fox Hollow - Preserve
- Alice Plan at Fox Hollow - Preserve
- 118 W Swainson Ave
- 3549 S Harrier Dr
- 3569 S Harrier Dr
- 3538 S Sharp Shinned Trail
- 3273 S Hawk Dr
- 3433 S Red Tailed Crescent Dr
- 3439 S Red Tailed Crescent Dr
- 3439 S Red Tailed Crescent
- 3429 S Red Tailed Crescent
- 306 W Red Tailed S
- 3421 S Red Tailed Crescent Dr Unit 8101
- 3421 S Red Tailed Crescent
- 282 W Kestrel Dr
- 316 W Red Tailed S
- 291 W Kestrel Dr
- 249 W Cooper Ave
- 260 W Cooper Ave
- 272 W Kestrel Dr Unit 8138
- 272 W Kestrel Dr
- 272 W Kestrel Dr
- 326 W Red Tailed Crescent Dr
- 283 W Kestrel Dr
- 283 Kestrel Dr
- 3403 S Red Tailed Crescent Dr
- 243 W Cooper Ave