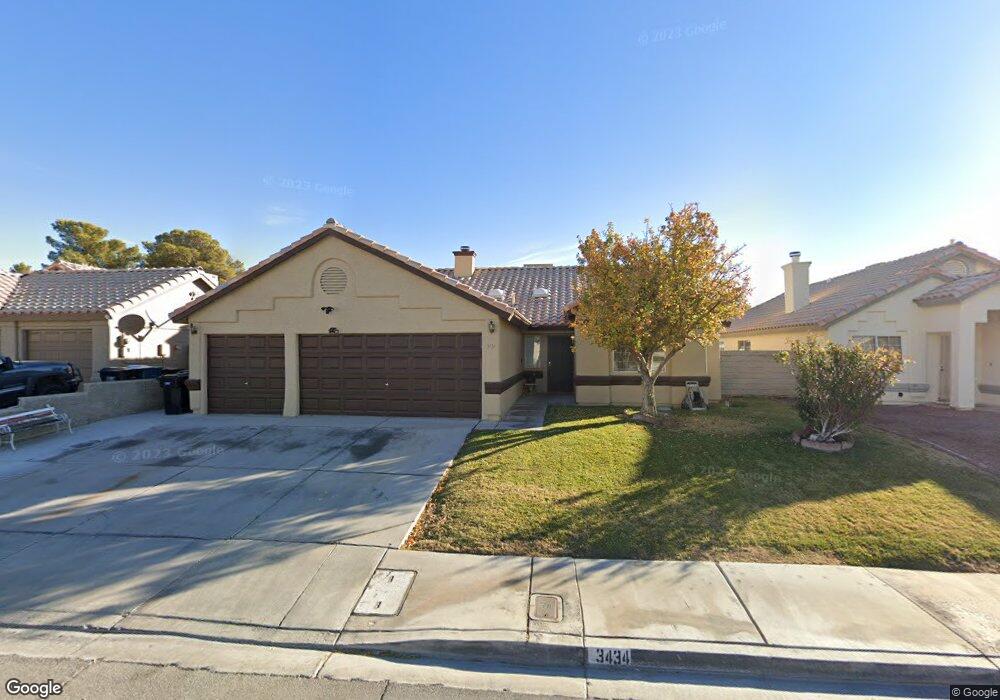
3434 Ferrell St North Las Vegas, NV 89032
Cheyenne NeighborhoodEstimated Value: $422,000 - $466,000
4
Beds
3
Baths
1,811
Sq Ft
$242/Sq Ft
Est. Value
About This Home
This home is located at 3434 Ferrell St, North Las Vegas, NV 89032 and is currently estimated at $439,106, approximately $242 per square foot. 3434 Ferrell St is a home located in Clark County with nearby schools including Lucile Bruner Elementary School, Theron L Swainston Middle School, and Cheyenne High School.
Ownership History
Date
Name
Owned For
Owner Type
Purchase Details
Closed on
Jan 21, 2020
Sold by
Coleman Banks Etta and Banks Etta
Bought by
Coleman Banks Etta
Current Estimated Value
Home Financials for this Owner
Home Financials are based on the most recent Mortgage that was taken out on this home.
Original Mortgage
$236,060
Outstanding Balance
$212,033
Interest Rate
4.5%
Mortgage Type
FHA
Estimated Equity
$227,073
Purchase Details
Closed on
Feb 28, 2003
Sold by
Banks Milton J
Bought by
Banks Milton J and Banks Etta
Home Financials for this Owner
Home Financials are based on the most recent Mortgage that was taken out on this home.
Original Mortgage
$26,000
Interest Rate
5.85%
Purchase Details
Closed on
May 9, 1997
Sold by
Norwest Mtg Inc
Bought by
Banks Milton J
Home Financials for this Owner
Home Financials are based on the most recent Mortgage that was taken out on this home.
Original Mortgage
$107,950
Interest Rate
7.98%
Mortgage Type
Balloon
Purchase Details
Closed on
Feb 25, 1997
Sold by
Watkins Richard A
Bought by
Norwest Mtg Inc
Purchase Details
Closed on
Jun 7, 1995
Sold by
Watkins Richard A
Bought by
Watkins Richard A and Smith Bettina
Create a Home Valuation Report for This Property
The Home Valuation Report is an in-depth analysis detailing your home's value as well as a comparison with similar homes in the area
Home Values in the Area
Average Home Value in this Area
Purchase History
| Date | Buyer | Sale Price | Title Company |
|---|---|---|---|
| Coleman Banks Etta | -- | Equity Title Of Nevada | |
| Banks Milton J | -- | Pioneer National Title | |
| Banks Milton J | $127,000 | Stewart Title | |
| Norwest Mtg Inc | $120,701 | United Title | |
| Watkins Richard A | -- | -- |
Source: Public Records
Mortgage History
| Date | Status | Borrower | Loan Amount |
|---|---|---|---|
| Open | Coleman Banks Etta | $236,060 | |
| Closed | Banks Milton J | $26,000 | |
| Closed | Banks Milton J | $107,950 |
Source: Public Records
Tax History Compared to Growth
Tax History
| Year | Tax Paid | Tax Assessment Tax Assessment Total Assessment is a certain percentage of the fair market value that is determined by local assessors to be the total taxable value of land and additions on the property. | Land | Improvement |
|---|---|---|---|---|
| 2025 | $1,624 | $96,235 | $26,600 | $69,635 |
| 2024 | $1,577 | $96,235 | $26,600 | $69,635 |
| 2023 | $1,577 | $94,484 | $28,350 | $66,134 |
| 2022 | $1,532 | $84,630 | $23,800 | $60,830 |
| 2021 | $1,487 | $78,387 | $20,300 | $58,087 |
| 2020 | $1,492 | $78,147 | $20,300 | $57,847 |
| 2019 | $1,399 | $72,912 | $15,750 | $57,162 |
| 2018 | $1,335 | $68,140 | $12,950 | $55,190 |
| 2017 | $2,282 | $68,039 | $11,900 | $56,139 |
| 2016 | $1,250 | $62,993 | $9,450 | $53,543 |
| 2015 | $1,247 | $48,764 | $5,250 | $43,514 |
| 2014 | $1,210 | $35,011 | $5,250 | $29,761 |
Source: Public Records
Map
Nearby Homes
- 3301 W Colton Ave
- 3104 W Colton Ave Unit 1
- 3336 Cheyenne Gardens Way
- 3548 Valley Lily St
- 3556 Valley Lily St
- 3606 Gold Sluice Ave
- 3254 Gold Run St
- 3505 Diamond Spur Ave
- 3335 Sutters Fort St
- 2906 Carothers Ct
- 3614 Newton Falls St
- 3503 Oberon Ln
- 3439 Cox St
- 3304 Simmons St
- 3524 Simmons St
- 3716 W Colton Ave
- 0 Simmons & Logan 3 Unit 2722103
- 3629 Newton Falls St Unit 4
- 3524 Silver Lantern Dr
- 0 Simmons & Logan 2 Unit 2722091
- 3438 Ferrell St
- 3430 Ferrell St
- 3133 Nebulous Cir
- 3426 Ferrell St
- 3442 Ferrell St
- 3134 Emeritus Cir
- 3129 Nebulous Cir
- 3130 Emeritus Cir
- 3433 Ferrell St
- 3134 Nebulous Cir
- 3429 Ferrell St
- 3422 Ferrell St
- 3446 Ferrell St
- 3446 Ferrell St Unit none
- 3437 Ferrell St
- 3425 Ferrell St
- 3125 Nebulous Cir
- 3305 W Delhi Ave
- 3130 Nebulous Cir
- 3126 Emeritus Cir