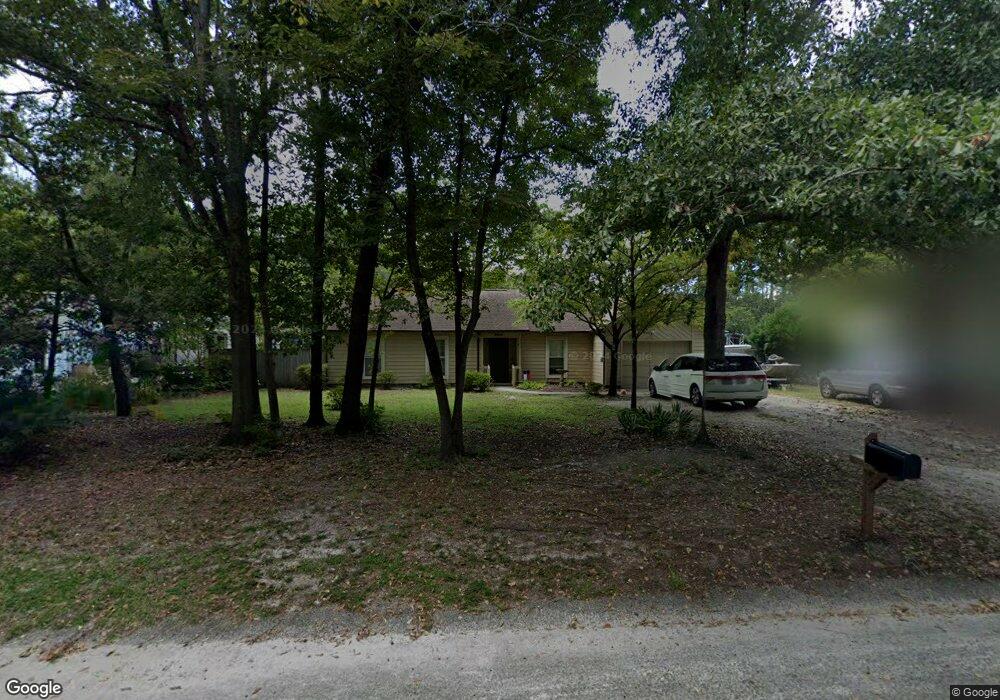
3434 Sparrow Hawk Ct Wilmington, NC 28409
Beasley NeighborhoodEstimated Value: $398,341 - $439,000
3
Beds
2
Baths
1,368
Sq Ft
$309/Sq Ft
Est. Value
About This Home
This home is located at 3434 Sparrow Hawk Ct, Wilmington, NC 28409 and is currently estimated at $422,585, approximately $308 per square foot. 3434 Sparrow Hawk Ct is a home located in New Hanover County with nearby schools including Holly Tree Elementary School, Roland-Grise Middle School, and John T. Hoggard High School.
Ownership History
Date
Name
Owned For
Owner Type
Purchase Details
Closed on
Sep 23, 2010
Sold by
Cox Jason R
Bought by
Cox Jason R and Cox Carrie M
Current Estimated Value
Purchase Details
Closed on
Dec 20, 2007
Sold by
Cox Cheryl W
Bought by
Cox Jason R
Home Financials for this Owner
Home Financials are based on the most recent Mortgage that was taken out on this home.
Original Mortgage
$177,500
Outstanding Balance
$111,885
Interest Rate
6.22%
Mortgage Type
Seller Take Back
Estimated Equity
$310,700
Purchase Details
Closed on
Jun 22, 2001
Sold by
Engle David S Jana B
Bought by
Cox Cheryl Williams
Purchase Details
Closed on
Feb 12, 1999
Sold by
Cook Elwood R Dolores E
Bought by
Engle David S Jana B
Purchase Details
Closed on
Mar 1, 1984
Sold by
Leon'S Home Center Inc
Bought by
Cook Elwood R Dolores E
Purchase Details
Closed on
Jan 1, 1984
Sold by
Real Estate Services Inc
Bought by
Leon'S Home Center Inc
Purchase Details
Closed on
Jan 1, 1983
Bought by
Real Estate Services Inc
Create a Home Valuation Report for This Property
The Home Valuation Report is an in-depth analysis detailing your home's value as well as a comparison with similar homes in the area
Home Values in the Area
Average Home Value in this Area
Purchase History
| Date | Buyer | Sale Price | Title Company |
|---|---|---|---|
| Cox Jason R | -- | None Available | |
| Cox Jason R | $177,500 | None Available | |
| Cox Cheryl Williams | $131,000 | -- | |
| Engle David S Jana B | $125,500 | -- | |
| Cook Elwood R Dolores E | $65,000 | -- | |
| Leon'S Home Center Inc | $22,500 | -- | |
| Real Estate Services Inc | -- | -- |
Source: Public Records
Mortgage History
| Date | Status | Borrower | Loan Amount |
|---|---|---|---|
| Open | Cox Jason R | $177,500 |
Source: Public Records
Tax History Compared to Growth
Tax History
| Year | Tax Paid | Tax Assessment Tax Assessment Total Assessment is a certain percentage of the fair market value that is determined by local assessors to be the total taxable value of land and additions on the property. | Land | Improvement |
|---|---|---|---|---|
| 2023 | $2,036 | $234,000 | $79,900 | $154,100 |
| 2022 | $0 | $234,000 | $79,900 | $154,100 |
| 2021 | $0 | $234,000 | $79,900 | $154,100 |
| 2020 | $1,815 | $172,300 | $44,000 | $128,300 |
| 2019 | $1,783 | $169,300 | $44,000 | $125,300 |
| 2018 | $0 | $169,300 | $44,000 | $125,300 |
| 2017 | $1,783 | $169,300 | $44,000 | $125,300 |
| 2016 | $1,691 | $152,600 | $44,000 | $108,600 |
| 2015 | $1,616 | $152,600 | $44,000 | $108,600 |
| 2014 | $1,547 | $152,600 | $44,000 | $108,600 |
Source: Public Records
Map
Nearby Homes
- 3427 Sparrow Hawk Ct
- 3405 Aster Ct
- 3418 Marsh Hawk Ct
- 3421 Bethel Rd
- 5420 Golden Eagle Ct
- 5425 Golden Eagle Ct
- 3004 Wickford Rd
- 1128 Beasley
- 3217 Jared Ct
- 1120 Beasley Rd
- 106 Brookview Rd
- 3501 Kyle Ct
- 3300 Upton Ct
- 3556 Iris St
- 101 Doughton Dr
- 736 Kelly Rd
- 209 Lancaster Rd
- 3149 Casa Ct
- 3629 Sutton Dr
- 125 N Hampton Rd
- 3432 Sparrow Hawk Ct
- 3436 Sparrow Hawk Ct
- 5403 Lark Ct
- 5400 Lark Ct
- 3430 Sparrow Hawk Ct
- 3438 Sparrow Hawk Ct
- 3433 Sparrow Hawk Ct
- 3431 Sparrow Hawk Ct
- 3435 Sparrow Hawk Ct
- 3401 Aster Ct
- 3428 Sparrow Hawk Ct
- 3429 Sparrow Hawk Ct
- 3440 Sparrow Hawk Ct
- 5402 Lark Ct
- 3437 Sparrow Hawk Ct
- 3435 Sea Eagle Ct
- 3426 Sparrow Hawk Ct
- 3409 Aster Ct
- 5406 Lark Ct
- 3436 Sea Eagle Ct