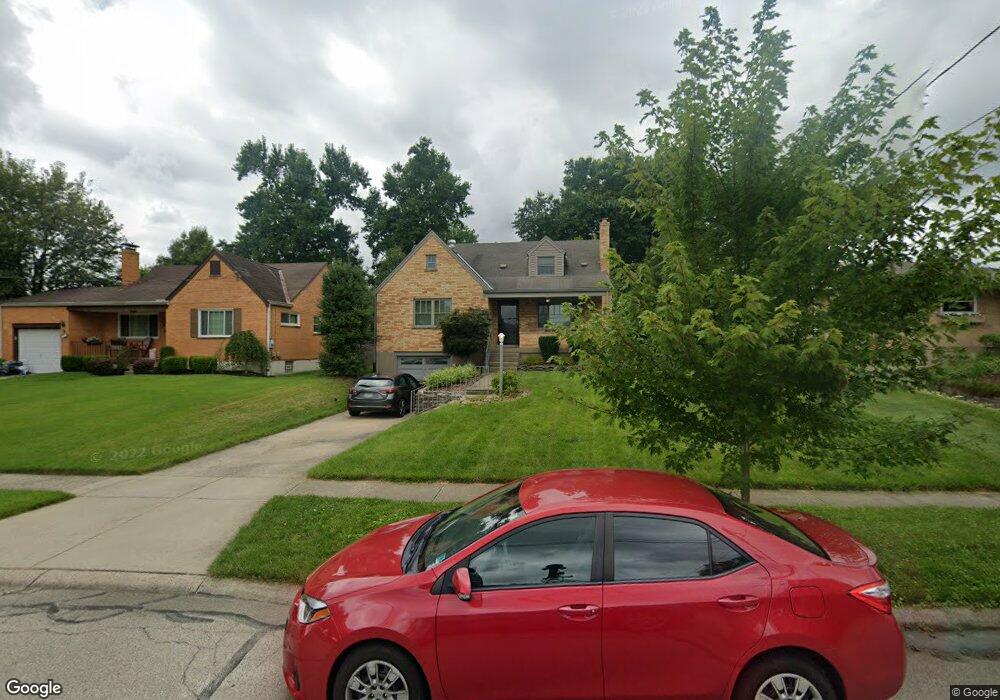
3435 Harwinton Ln Cincinnati, OH 45248
Estimated Value: $288,000 - $312,000
4
Beds
1
Bath
1,560
Sq Ft
$191/Sq Ft
Est. Value
About This Home
This home is located at 3435 Harwinton Ln, Cincinnati, OH 45248 and is currently estimated at $298,731, approximately $191 per square foot. 3435 Harwinton Ln is a home located in Hamilton County with nearby schools including Oakdale Elementary School, Bridgetown Middle School, and Oak Hills High School.
Ownership History
Date
Name
Owned For
Owner Type
Purchase Details
Closed on
Jun 15, 2021
Sold by
Smith Nathan D and Smith Sharon L
Bought by
Simms Kyle and Weitzel Nicole A
Current Estimated Value
Home Financials for this Owner
Home Financials are based on the most recent Mortgage that was taken out on this home.
Original Mortgage
$199,200
Outstanding Balance
$178,772
Interest Rate
2.9%
Mortgage Type
New Conventional
Estimated Equity
$119,959
Purchase Details
Closed on
Mar 7, 2005
Sold by
Smith Vincent and Smith Sandra
Bought by
Smith Nathan D and Smith Sharon L
Home Financials for this Owner
Home Financials are based on the most recent Mortgage that was taken out on this home.
Original Mortgage
$117,280
Interest Rate
5.71%
Mortgage Type
Balloon
Purchase Details
Closed on
Dec 15, 1993
Sold by
Bear Terry L and Bear Barbara A
Bought by
Smith Vincent and Smith Sandra M
Create a Home Valuation Report for This Property
The Home Valuation Report is an in-depth analysis detailing your home's value as well as a comparison with similar homes in the area
Home Values in the Area
Average Home Value in this Area
Purchase History
| Date | Buyer | Sale Price | Title Company |
|---|---|---|---|
| Simms Kyle | $249,000 | Lawyers Title | |
| Simms Kyle | -- | None Listed On Document | |
| Smith Nathan D | $146,600 | None Available | |
| Smith Vincent | -- | -- |
Source: Public Records
Mortgage History
| Date | Status | Borrower | Loan Amount |
|---|---|---|---|
| Open | Simms Kyle | $199,200 | |
| Closed | Simms Kyle | $199,200 | |
| Previous Owner | Smith Nathan D | $117,280 |
Source: Public Records
Tax History
| Year | Tax Paid | Tax Assessment Tax Assessment Total Assessment is a certain percentage of the fair market value that is determined by local assessors to be the total taxable value of land and additions on the property. | Land | Improvement |
|---|---|---|---|---|
| 2025 | $4,540 | $87,150 | $14,070 | $73,080 |
| 2024 | $4,427 | $87,150 | $14,070 | $73,080 |
| 2023 | $4,431 | $87,150 | $14,070 | $73,080 |
| 2022 | $3,262 | $54,328 | $12,569 | $41,759 |
| 2021 | $2,930 | $54,328 | $12,569 | $41,759 |
| 2020 | $2,968 | $54,328 | $12,569 | $41,759 |
| 2019 | $2,905 | $48,507 | $11,221 | $37,286 |
| 2018 | $2,909 | $48,507 | $11,221 | $37,286 |
| 2017 | $2,742 | $48,507 | $11,221 | $37,286 |
| 2016 | $2,569 | $45,371 | $11,529 | $33,842 |
| 2015 | $2,591 | $45,371 | $11,529 | $33,842 |
| 2014 | $2,595 | $45,371 | $11,529 | $33,842 |
| 2013 | $2,449 | $45,830 | $11,645 | $34,185 |
Source: Public Records
Map
Nearby Homes
- 3433 Tolland Ct
- 5961 Lawrence Rd
- 5918 Leeside Trail
- 3454 Eyrich Rd
- 3589 Eyrich Rd
- 3570 Eyrich Rd
- 5869 Weston Ct
- 2 Ebenezer Rd
- 3311 Starhaven Trail
- 6233 Sharlene Dr
- 5696 Biscayne Ave
- 3737 Vollmer Place
- 5647 N Glen Rd
- 6214 Berauer Rd
- 5630 Eula Ave
- 3307 Glenmont Ln
- 5584 Green Acres Ct
- 5696 Bridgetown Rd
- 5549 Surrey Ave
- 5648 Bridgetown Rd
- 3429 Harwinton Ln
- 3441 Harwinton Ln
- 3449 Harwinton Ln
- 3455 Harwinton Ln
- 6068 Lawrence Rd
- 6074 Lawrence Rd
- 6060 Lawrence Rd
- 6080 Lawrence Rd
- 3444 Ebenezer Rd
- 3432 Ebenezer Rd
- 3434 Harwinton Ln
- 3463 Harwinton Ln
- 3440 Harwinton Ln
- 3410 Harwinton Ln
- 3420 Ebenezer Rd
- 3448 Harwinton Ln
- 3456 Harwinton Ln
- 6040 Lawrence Rd
- 3462 Harwinton Ln
- 34428 Harwinton Ln
Your Personal Tour Guide
Ask me questions while you tour the home.