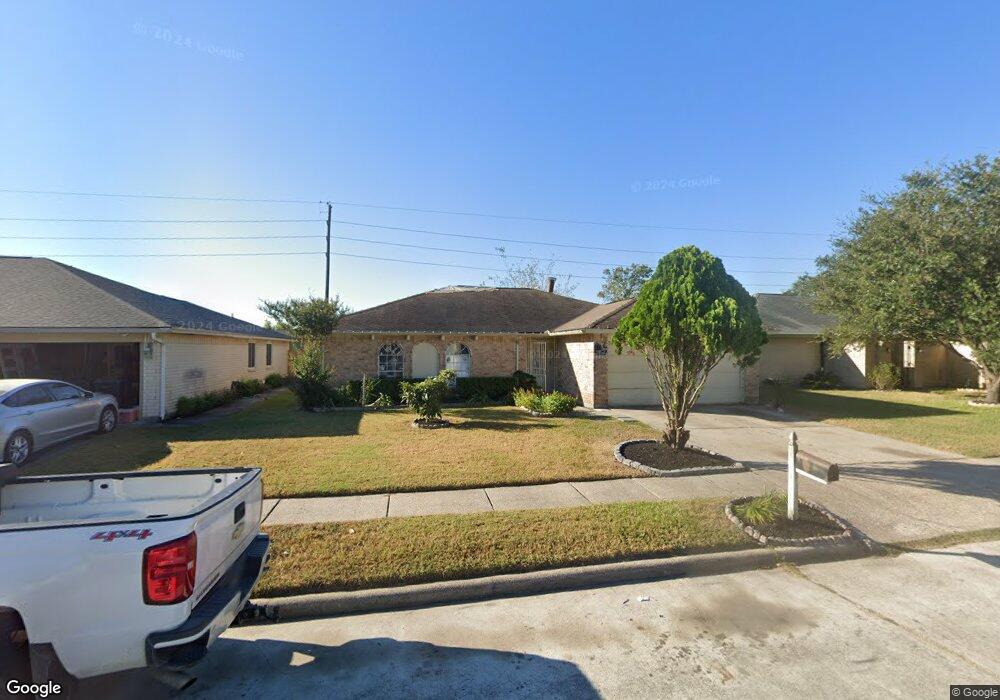
3435 Hombly Rd Houston, TX 77066
Champions NeighborhoodEstimated Value: $208,000 - $238,000
3
Beds
2
Baths
1,656
Sq Ft
$133/Sq Ft
Est. Value
About This Home
This home is located at 3435 Hombly Rd, Houston, TX 77066 and is currently estimated at $220,438, approximately $133 per square foot. 3435 Hombly Rd is a home located in Harris County with nearby schools including Griggs EC/PK/K, Conley Elementary School, and Plummer Middle School.
Ownership History
Date
Name
Owned For
Owner Type
Purchase Details
Closed on
Aug 20, 2025
Sold by
Harris County and Herman Mark
Bought by
Mcwashington Kechia
Current Estimated Value
Purchase Details
Closed on
Jun 8, 2001
Sold by
Samuels Stewart T and Samuels Carmen T
Bought by
Angel Ernesto
Home Financials for this Owner
Home Financials are based on the most recent Mortgage that was taken out on this home.
Original Mortgage
$75,510
Interest Rate
11.5%
Purchase Details
Closed on
Sep 30, 1997
Sold by
Torres Raul R and Torres Sylvia F
Bought by
Samuels Stewart L and Samuels Carmen T
Home Financials for this Owner
Home Financials are based on the most recent Mortgage that was taken out on this home.
Original Mortgage
$61,609
Interest Rate
7.49%
Mortgage Type
FHA
Create a Home Valuation Report for This Property
The Home Valuation Report is an in-depth analysis detailing your home's value as well as a comparison with similar homes in the area
Home Values in the Area
Average Home Value in this Area
Purchase History
| Date | Buyer | Sale Price | Title Company |
|---|---|---|---|
| Mcwashington Kechia | $69,000 | None Listed On Document | |
| Angel Ernesto | -- | Stewart Title | |
| Samuels Stewart L | -- | Stewart Title |
Source: Public Records
Mortgage History
| Date | Status | Borrower | Loan Amount |
|---|---|---|---|
| Previous Owner | Angel Ernesto | $75,510 | |
| Previous Owner | Samuels Stewart L | $61,609 |
Source: Public Records
Tax History Compared to Growth
Tax History
| Year | Tax Paid | Tax Assessment Tax Assessment Total Assessment is a certain percentage of the fair market value that is determined by local assessors to be the total taxable value of land and additions on the property. | Land | Improvement |
|---|---|---|---|---|
| 2025 | $4,920 | $204,417 | $36,765 | $167,652 |
| 2024 | $4,920 | $202,082 | $37,996 | $164,086 |
| 2023 | $4,920 | $211,512 | $37,996 | $173,516 |
| 2022 | $4,849 | $186,403 | $24,998 | $161,405 |
| 2021 | $4,225 | $153,324 | $24,998 | $128,326 |
| 2020 | $4,036 | $135,826 | $24,998 | $110,828 |
| 2019 | $3,809 | $123,318 | $13,200 | $110,118 |
| 2018 | $1,669 | $116,208 | $13,200 | $103,008 |
| 2017 | $3,247 | $107,306 | $13,200 | $94,106 |
| 2016 | $2,907 | $107,306 | $13,200 | $94,106 |
| 2015 | $2,173 | $91,414 | $13,200 | $78,214 |
| 2014 | $2,173 | $79,377 | $13,200 | $66,177 |
Source: Public Records
Map
Nearby Homes
- 11322 Yorklyn Dr
- 3519 Hombly Rd
- 11335 Chelsea Walk Dr
- 11427 Valarno Dr
- 14207 Timberhaven Dr
- 3446 Cheaney Dr
- 3407 Sandbrook Dr
- 14118 Magnolia Springs Dr
- 11703 Cliveden Dr
- 14003 Valley Grove Dr
- 11544 Springshire Dr
- 11822 Winter Park St
- 11818 Guadalupe River Dr
- 11835 Guadalupe River Dr
- 11811 Spruce Mountain Dr
- 11525 Teaside Dr
- 3838 Buckhurst Dr
- 11707 Steamboat Springs Dr
- 3240 Brownie Campbell Rd
- 11009 Panicum Ct
- 3431 Hombly Rd
- 3439 Hombly Rd
- 3443 Hombly Rd
- 3427 Hombly Rd
- 3434 Hombly Rd
- 3430 Hombly Rd
- 3438 Hombly Rd
- 3447 Hombly Rd
- 3423 Hombly Rd
- 3426 Hombly Rd
- 3442 Hombly Rd
- 3422 Hombly Rd
- 3451 Hombly Rd
- 3446 Hombly Rd
- 3427 Wahalla Dr
- 3427 Walhalla Dr
- 11311 Hombly Ct
- 3431 Walhalla Dr
- 3423 Walhalla Dr
- 3435 Walhalla Dr